Free Access
Fig. A.1
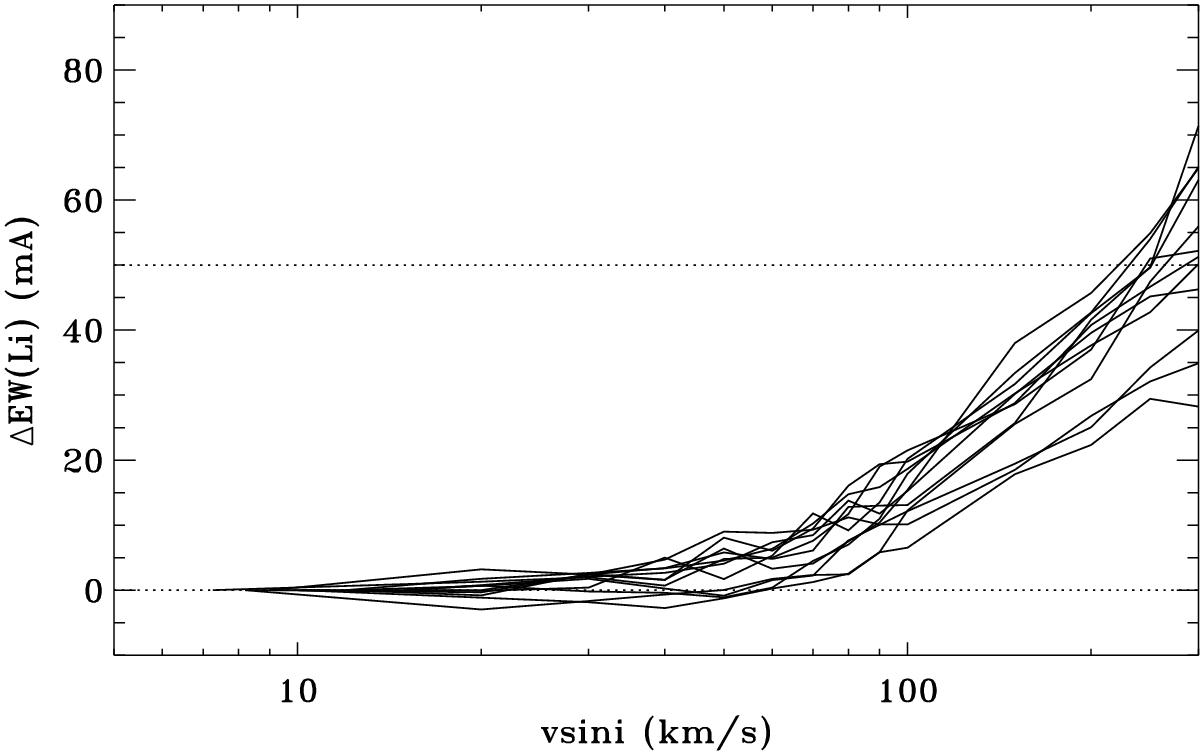
Differences in EW(Li) measurements between artificially broadened spectra and the original spectra for a selected sample of stars (see text for details). The dotted line indicates the approximate distance between the Li-excess and Li-deficient distributions.
Current usage metrics show cumulative count of Article Views (full-text article views including HTML views, PDF and ePub downloads, according to the available data) and Abstracts Views on Vision4Press platform.
Data correspond to usage on the plateform after 2015. The current usage metrics is available 48-96 hours after online publication and is updated daily on week days.
Initial download of the metrics may take a while.