Fig. 7
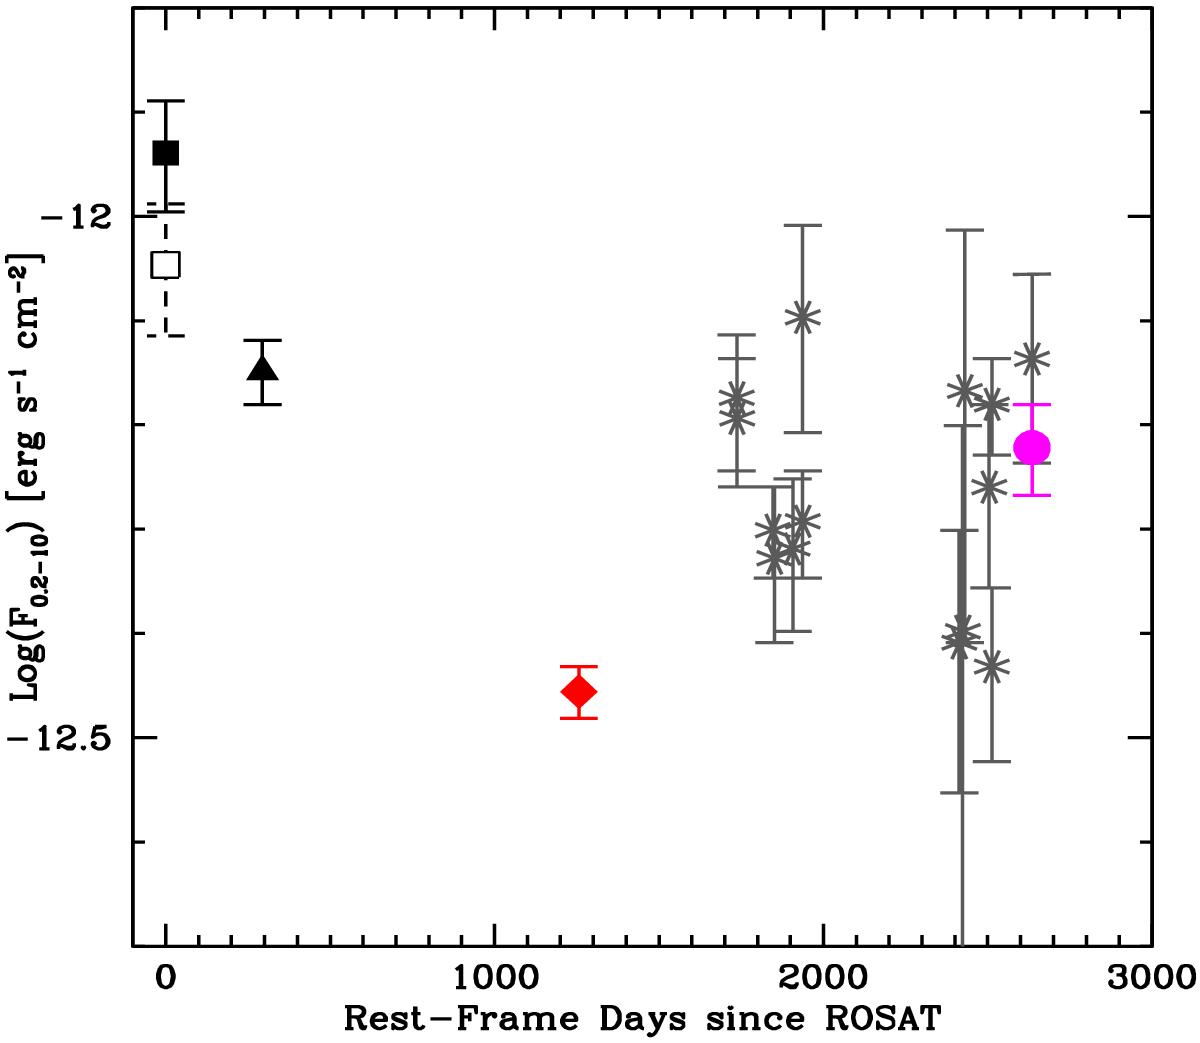
Rest-frame 0.2−10 keV light-curve of PG1247 since its first detection with ROSAT in 1993 (black filled square). The empty square shows the ROSAT data reanalyzed in Boller et al. (2016). The black triangle represents the ASCA measurement (1995). The red diamond represents the XMM-Newton measurement of 2003. The gray points represent the monitoring performed with Swift between 2007 and 2013 (Shemmer et al. 2014), and the magenta point shows the NuSTAR measurement in 2014.
Current usage metrics show cumulative count of Article Views (full-text article views including HTML views, PDF and ePub downloads, according to the available data) and Abstracts Views on Vision4Press platform.
Data correspond to usage on the plateform after 2015. The current usage metrics is available 48-96 hours after online publication and is updated daily on week days.
Initial download of the metrics may take a while.