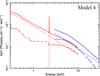
Fig. 5
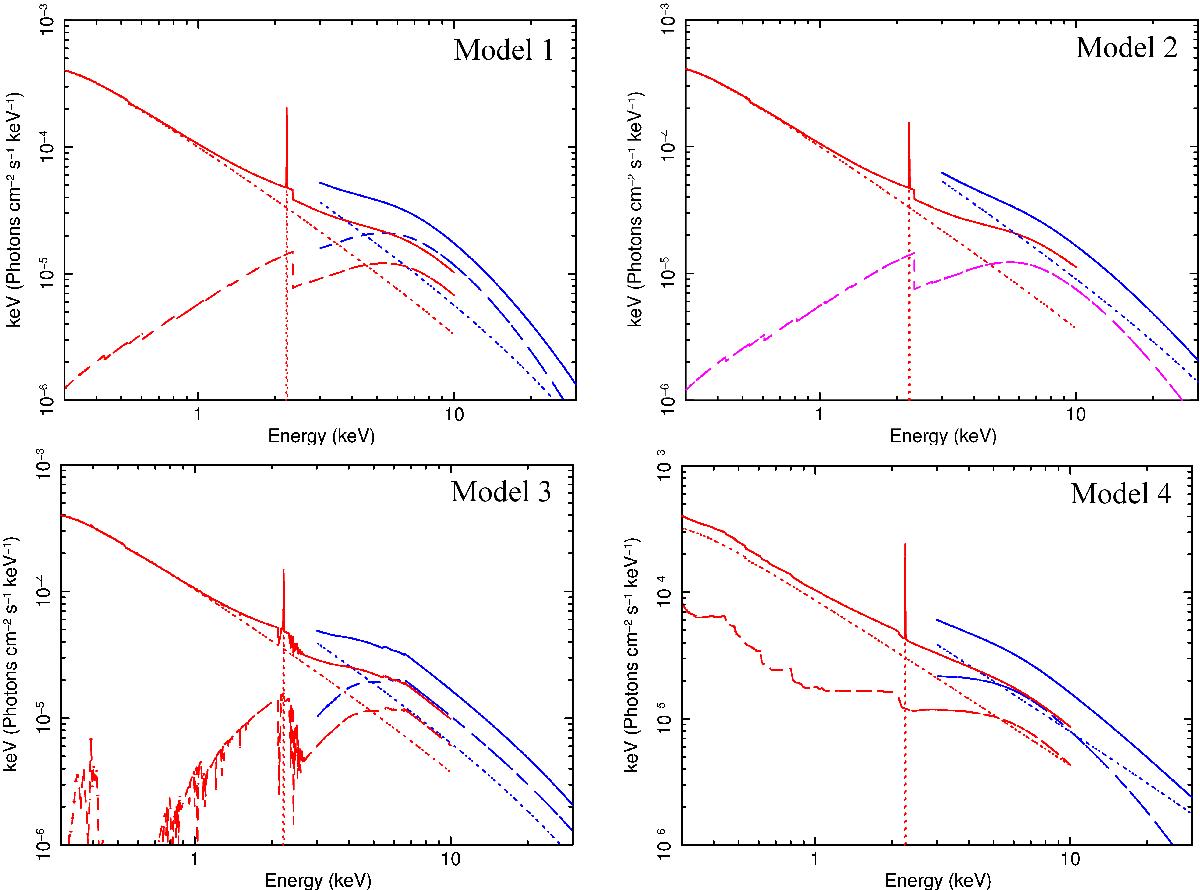
Best-fit unfolded models for models 1, 2, 3, and 4, from top left to bottom right. The continuous curves represents the best fit to the XMM-Newton data (in red) and NuSTAR data (in blue). The dotted curves represent the primary power law, while the dashed curves represent the component reproducing the hump (either reflection or absorption). In the top right panel the magenta curve represents the constant reflection component underlying both XMM-Newton and NuSTAR data, modeled with PEXRAV.
Current usage metrics show cumulative count of Article Views (full-text article views including HTML views, PDF and ePub downloads, according to the available data) and Abstracts Views on Vision4Press platform.
Data correspond to usage on the plateform after 2015. The current usage metrics is available 48-96 hours after online publication and is updated daily on week days.
Initial download of the metrics may take a while.