Fig. 3
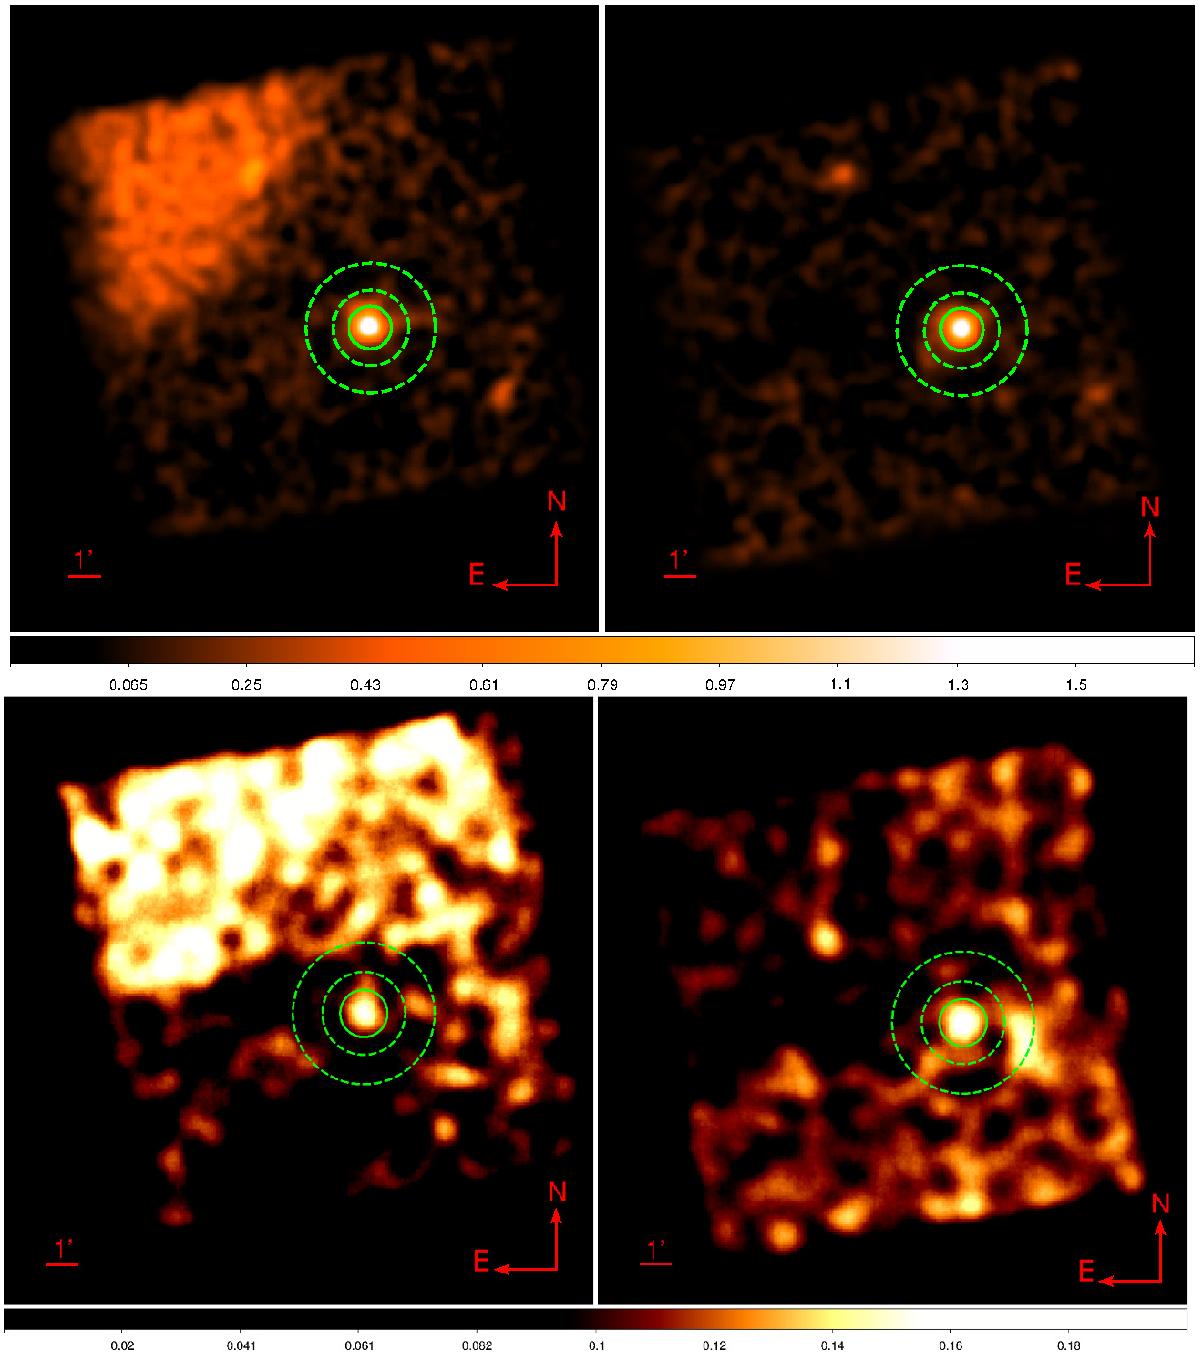
Top: 3−79 keV background-subtracted images of the NuSTAR observation of PG1247 (FPMA left and FPMB right). Contamination from the Coma cluster is visible in the upper left corner of FPMA. Bottom: 15−30 keV NuSTAR images, not background subtracted. In both panels the 1′ scale is shown, and the source and background extraction regions are shown with continuous and dashed lines, respectively. North is up and east is left.
Current usage metrics show cumulative count of Article Views (full-text article views including HTML views, PDF and ePub downloads, according to the available data) and Abstracts Views on Vision4Press platform.
Data correspond to usage on the plateform after 2015. The current usage metrics is available 48-96 hours after online publication and is updated daily on week days.
Initial download of the metrics may take a while.