Fig. 2
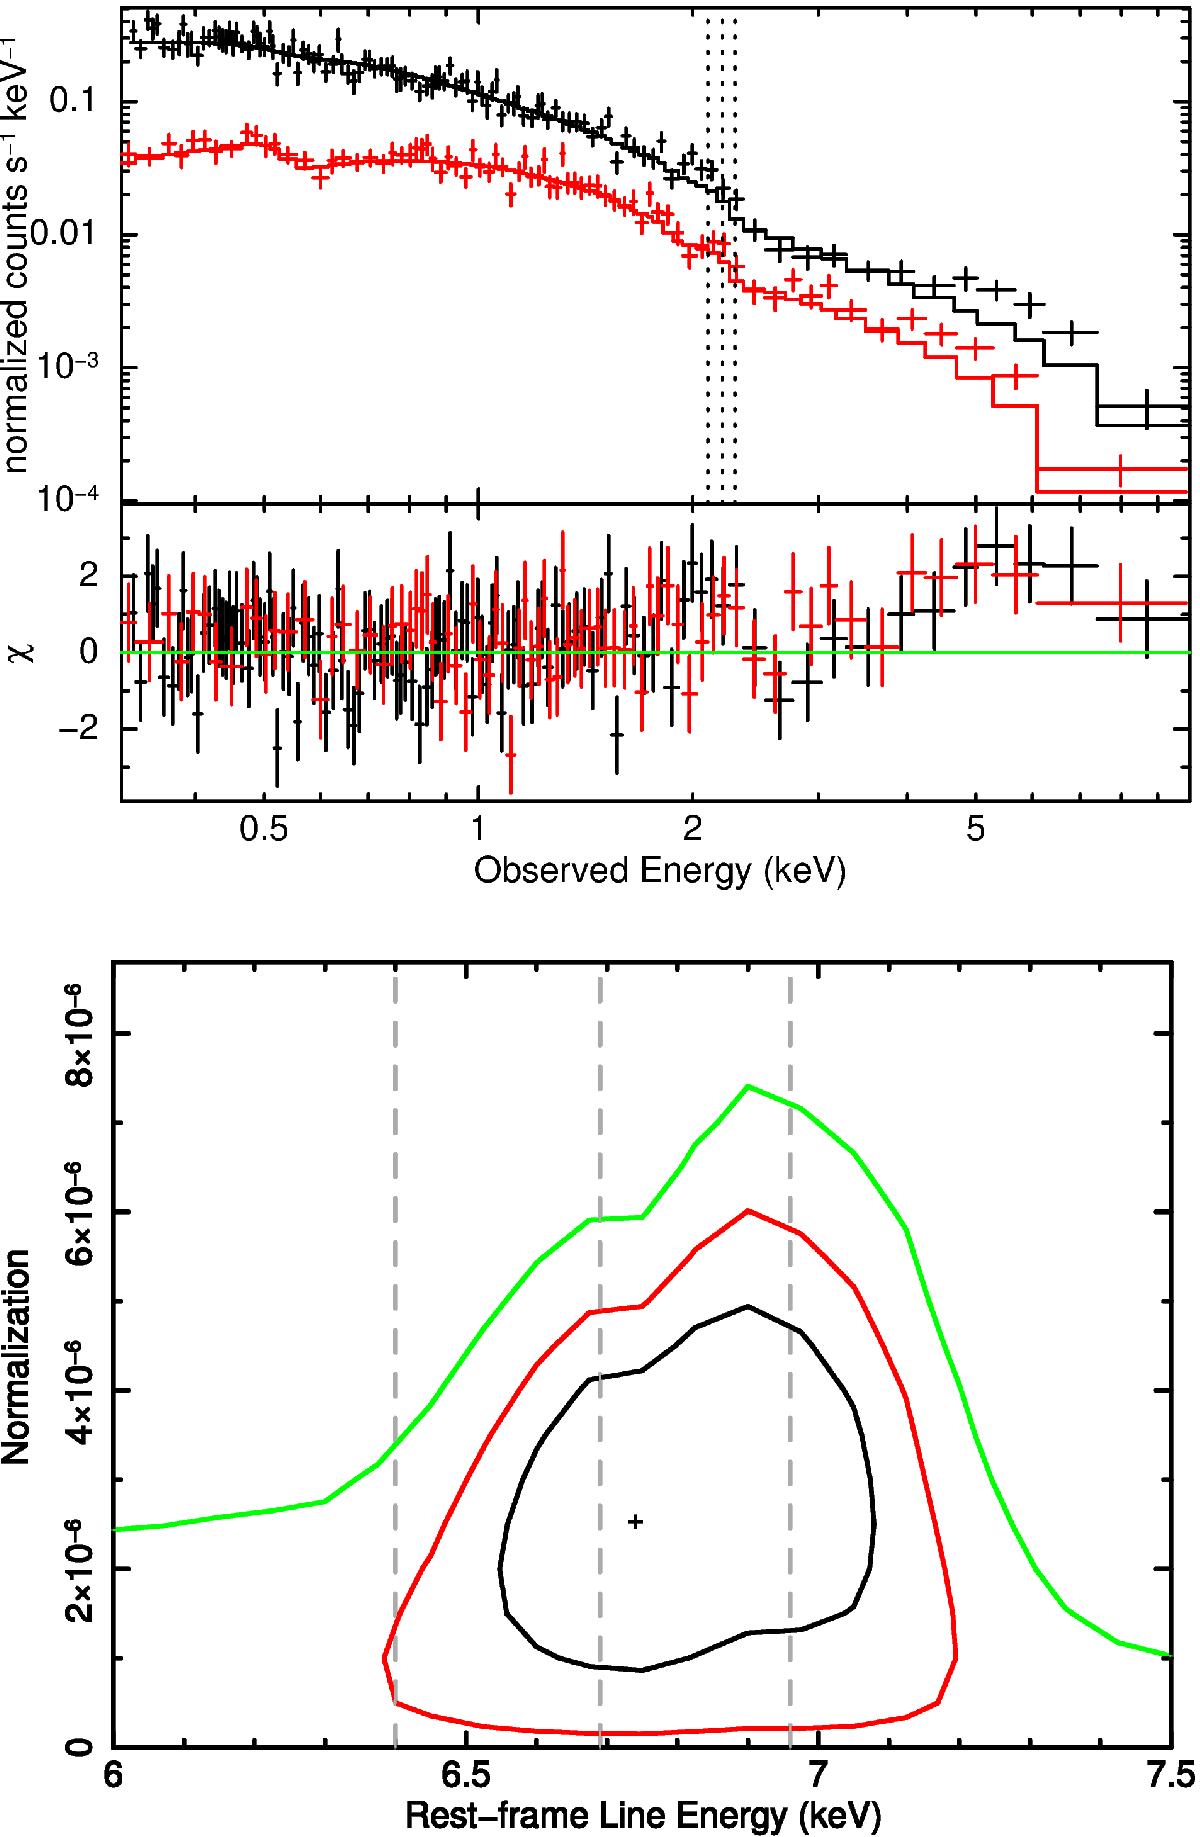
Top: XMM-Newton pn (black) and MOS1+2 (red) spectra of PG1247. The model is a simple power law fitted to the 0.3−2 keV observed band to highlight the residuals above 2 keV due to the emission line complex and the strong reflection component. Bottom: contour plot (at 68, 90, and 99% c.l.) for the emission line energy (rest frame) and normalization. In both panels the dashed lines mark the expected neutral Fe, FeXXV, and FeXXVI Kα emission line energies.
Current usage metrics show cumulative count of Article Views (full-text article views including HTML views, PDF and ePub downloads, according to the available data) and Abstracts Views on Vision4Press platform.
Data correspond to usage on the plateform after 2015. The current usage metrics is available 48-96 hours after online publication and is updated daily on week days.
Initial download of the metrics may take a while.