Fig. 1
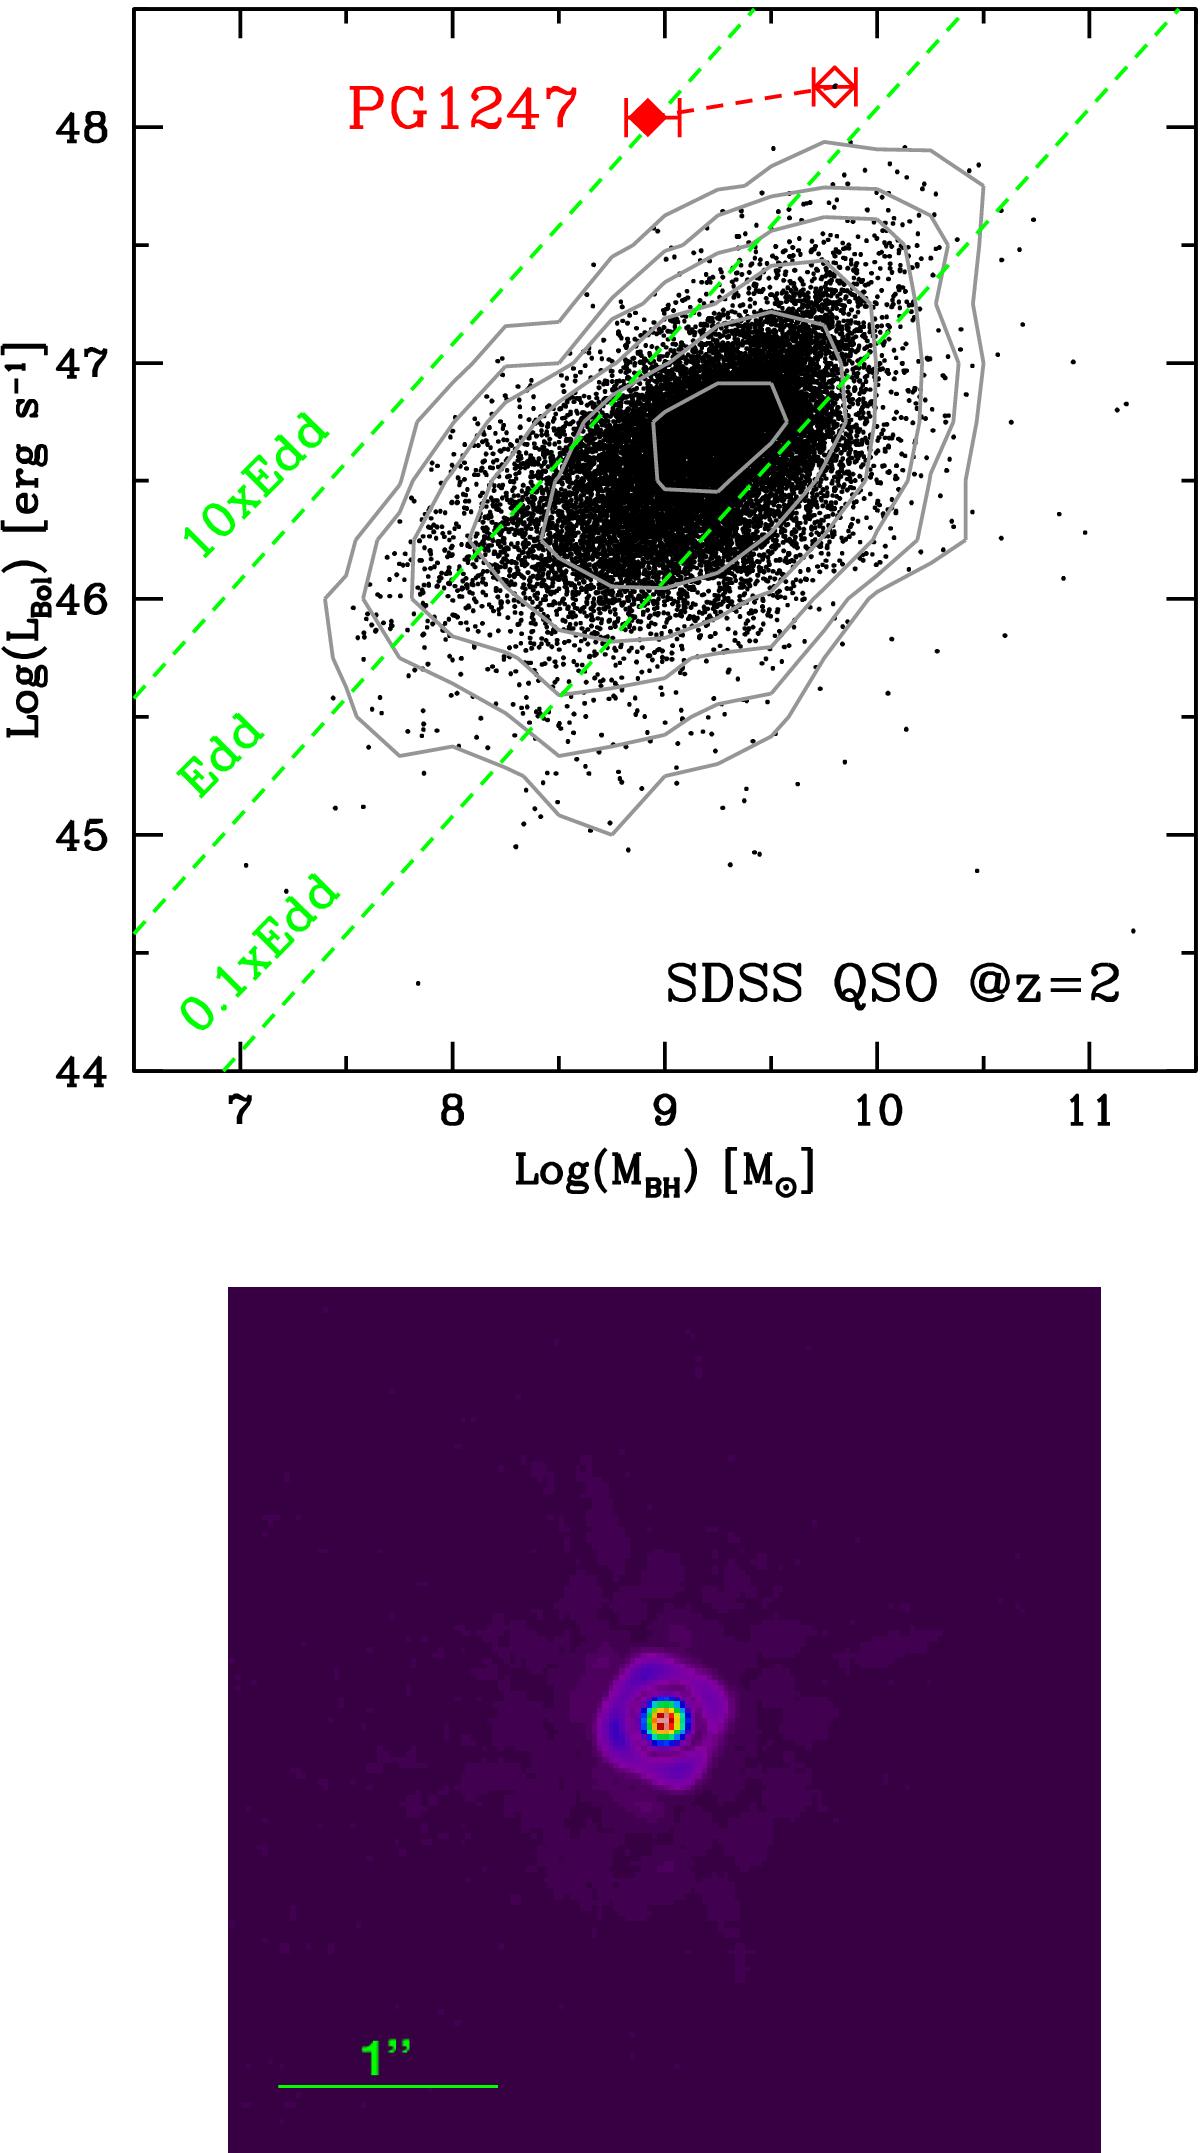
Top: Lbol and MBH for the 1.8 < z < 2.2 SDSS QSO sample (black points and gray contours). Values for PG1247 from SDSS (Shen et al. 2011) and from Trevese et al. (2014) are shown with empty and filled red diamonds, respectively. Dashed green lines mark different λEdd values. Bottom: 4″ × 4″ HST-NICMOS image of PG1247 (filter F160W). The 1′′ scale is shown.
Current usage metrics show cumulative count of Article Views (full-text article views including HTML views, PDF and ePub downloads, according to the available data) and Abstracts Views on Vision4Press platform.
Data correspond to usage on the plateform after 2015. The current usage metrics is available 48-96 hours after online publication and is updated daily on week days.
Initial download of the metrics may take a while.