Free Access
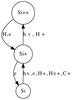
Fig. 1
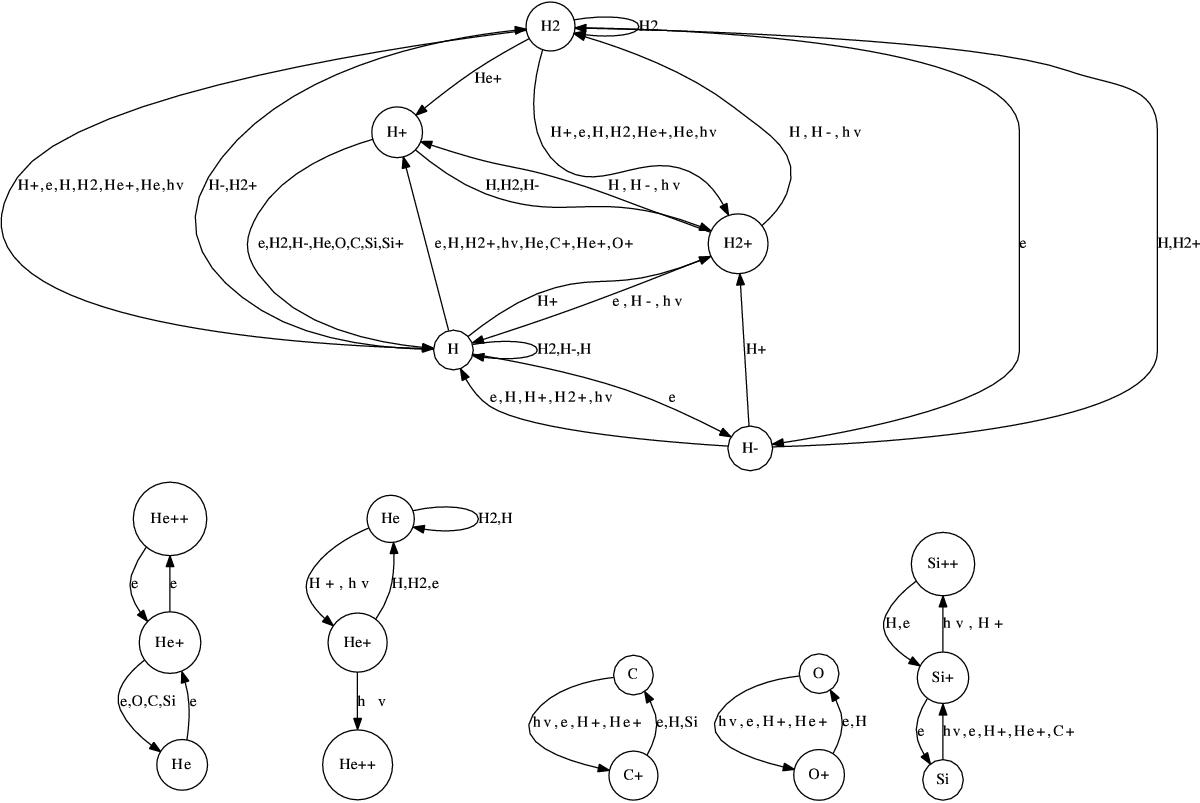
Network graphs for H, He, C, Si, and O as the main hubs. Helium has been split into two small sub-networks, the one on the left showing the reactions with metals, and the one on the right the reactions with hydrogen-based species and photons. The network graphs can be obtained by using the KROME tool pathway.py.
This figure is made of several images, please see below:
Current usage metrics show cumulative count of Article Views (full-text article views including HTML views, PDF and ePub downloads, according to the available data) and Abstracts Views on Vision4Press platform.
Data correspond to usage on the plateform after 2015. The current usage metrics is available 48-96 hours after online publication and is updated daily on week days.
Initial download of the metrics may take a while.