Fig. 2
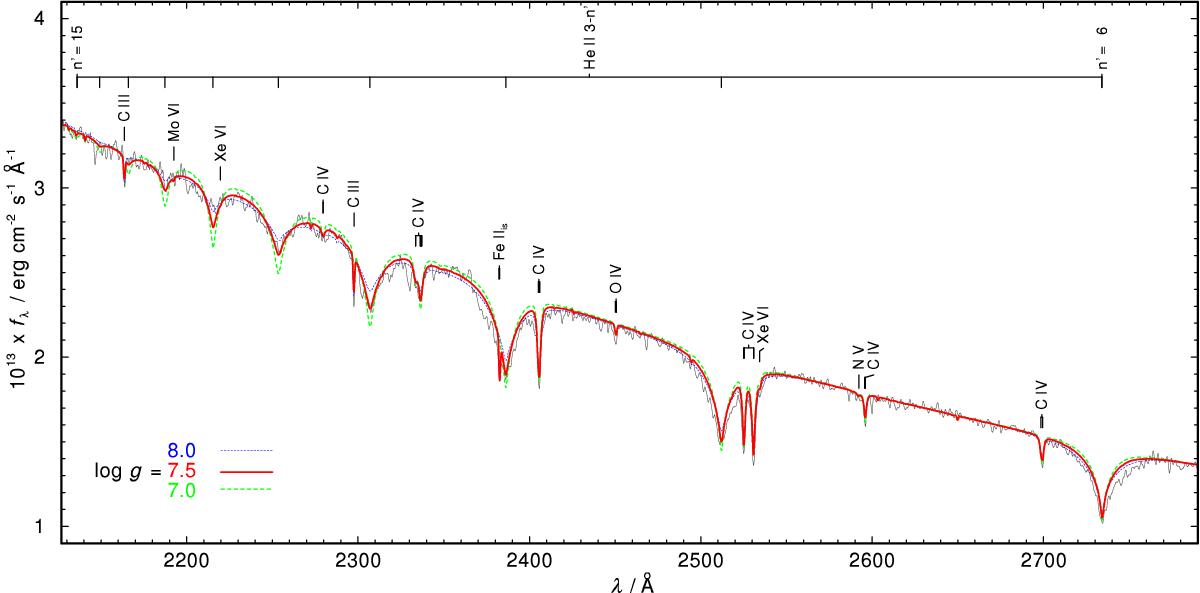
Section of the HST/STIS spectrum, compared with models with different log g of 7.0 (thin, green, dashed), 7.5 (thick, red), and 8.0 (thin, blue, dashed) and Teff = 70000 K. The synthetic spectra are normalized to match the flux of the observation at 2800 Å, respectively. All spectra are convolved with Gaussians (full width at half maximum of 1 Å) for clarity. Identified lines are indicated. “is” denotes interstellar origin.
Current usage metrics show cumulative count of Article Views (full-text article views including HTML views, PDF and ePub downloads, according to the available data) and Abstracts Views on Vision4Press platform.
Data correspond to usage on the plateform after 2015. The current usage metrics is available 48-96 hours after online publication and is updated daily on week days.
Initial download of the metrics may take a while.