Fig. 1
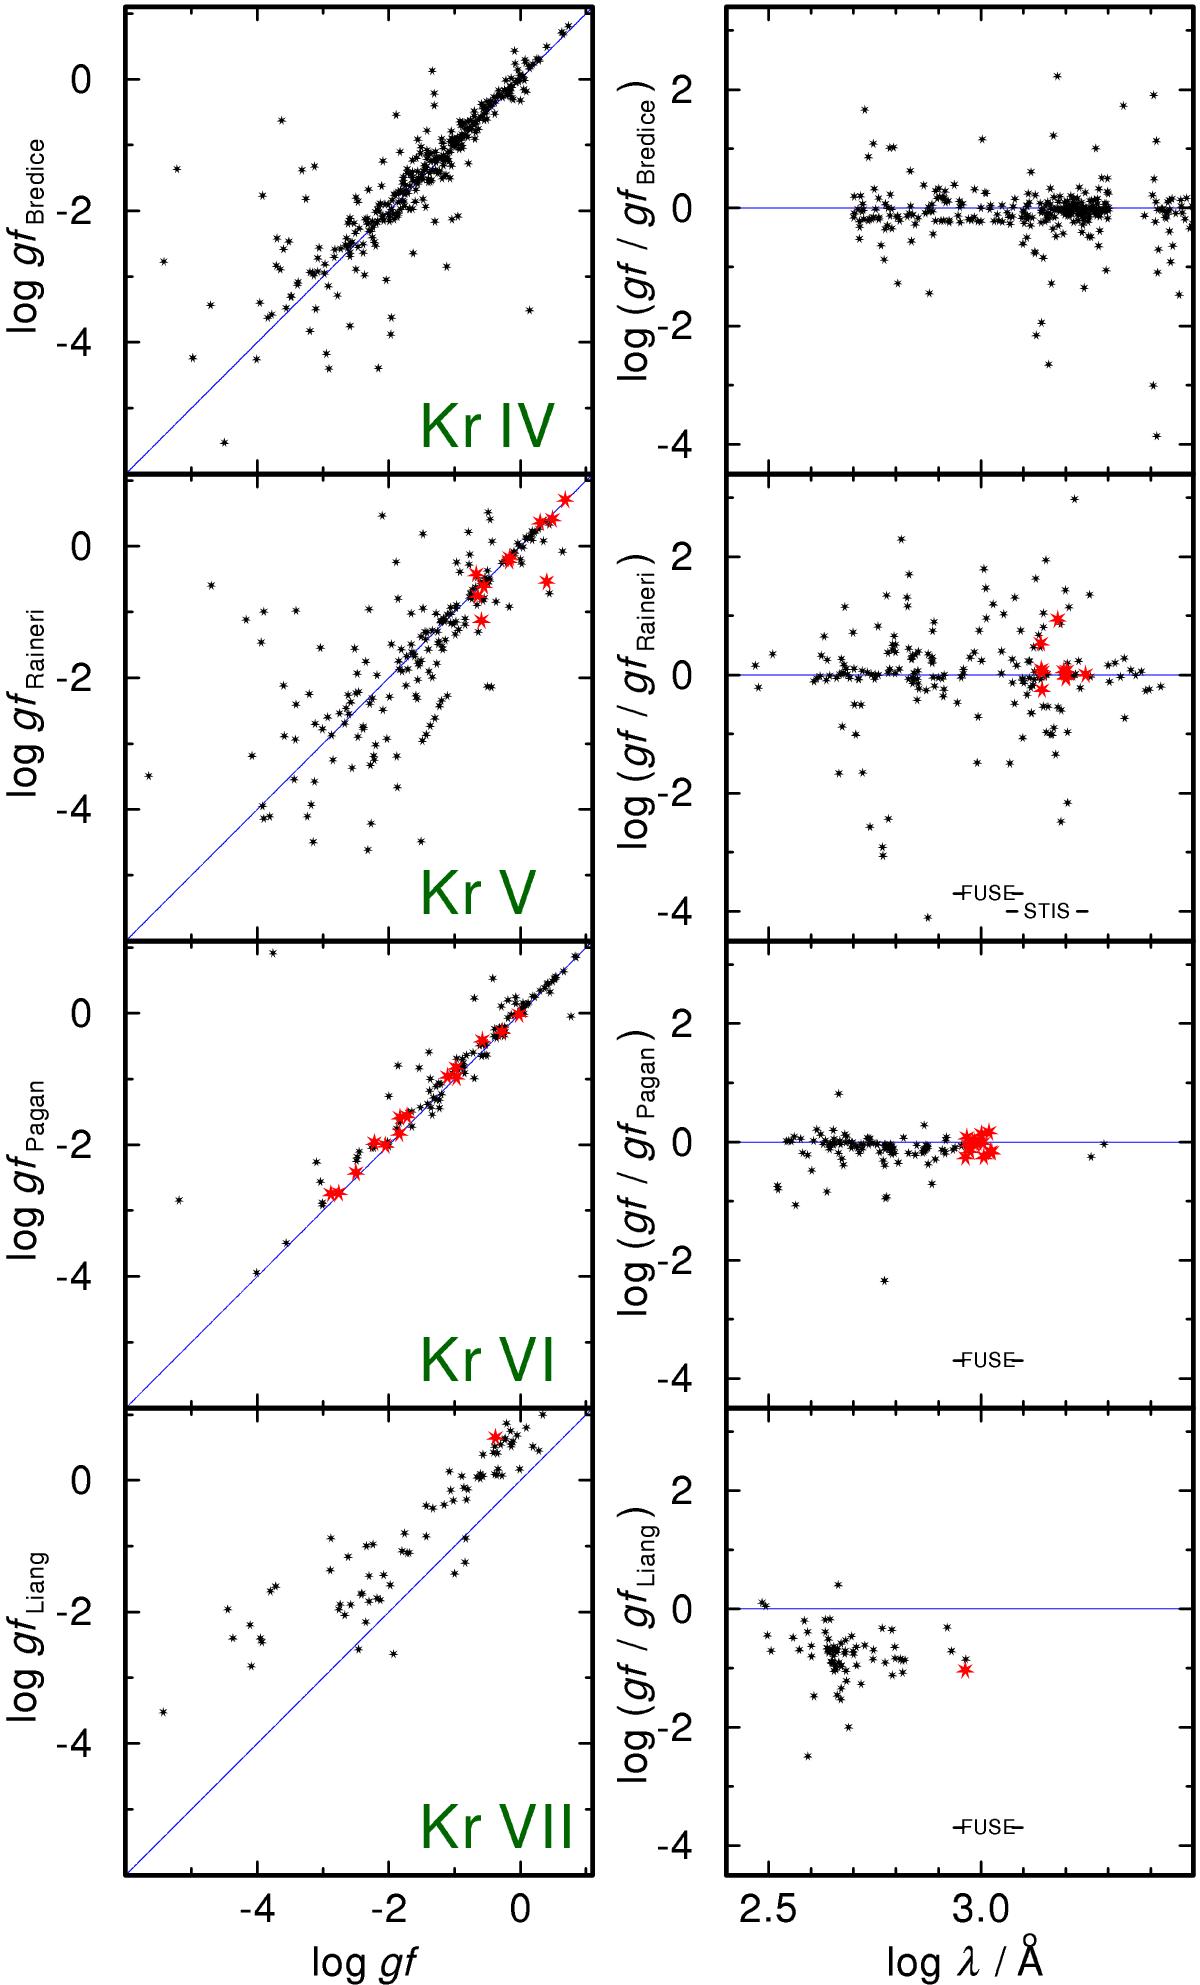
Comparison of our weighted oscillator strengths for Kr iv–vii (from top to bottom) to those of Bredice et al. (2000), Raineri et al. (2012), Pagan et al. (1996), and Liang et al. (2013), respectively. Left panel: comparison of weighted oscillator strengths. Right panel: ratio of weighted oscillator strengths over wavelength. The wavelength ranges of our FUSE and HST/STIS spectra are marked. The larger, red symbols refer to the lines identified in RE 0503−289 (see Figs. 5 and 8).
Current usage metrics show cumulative count of Article Views (full-text article views including HTML views, PDF and ePub downloads, according to the available data) and Abstracts Views on Vision4Press platform.
Data correspond to usage on the plateform after 2015. The current usage metrics is available 48-96 hours after online publication and is updated daily on week days.
Initial download of the metrics may take a while.