Fig. 7
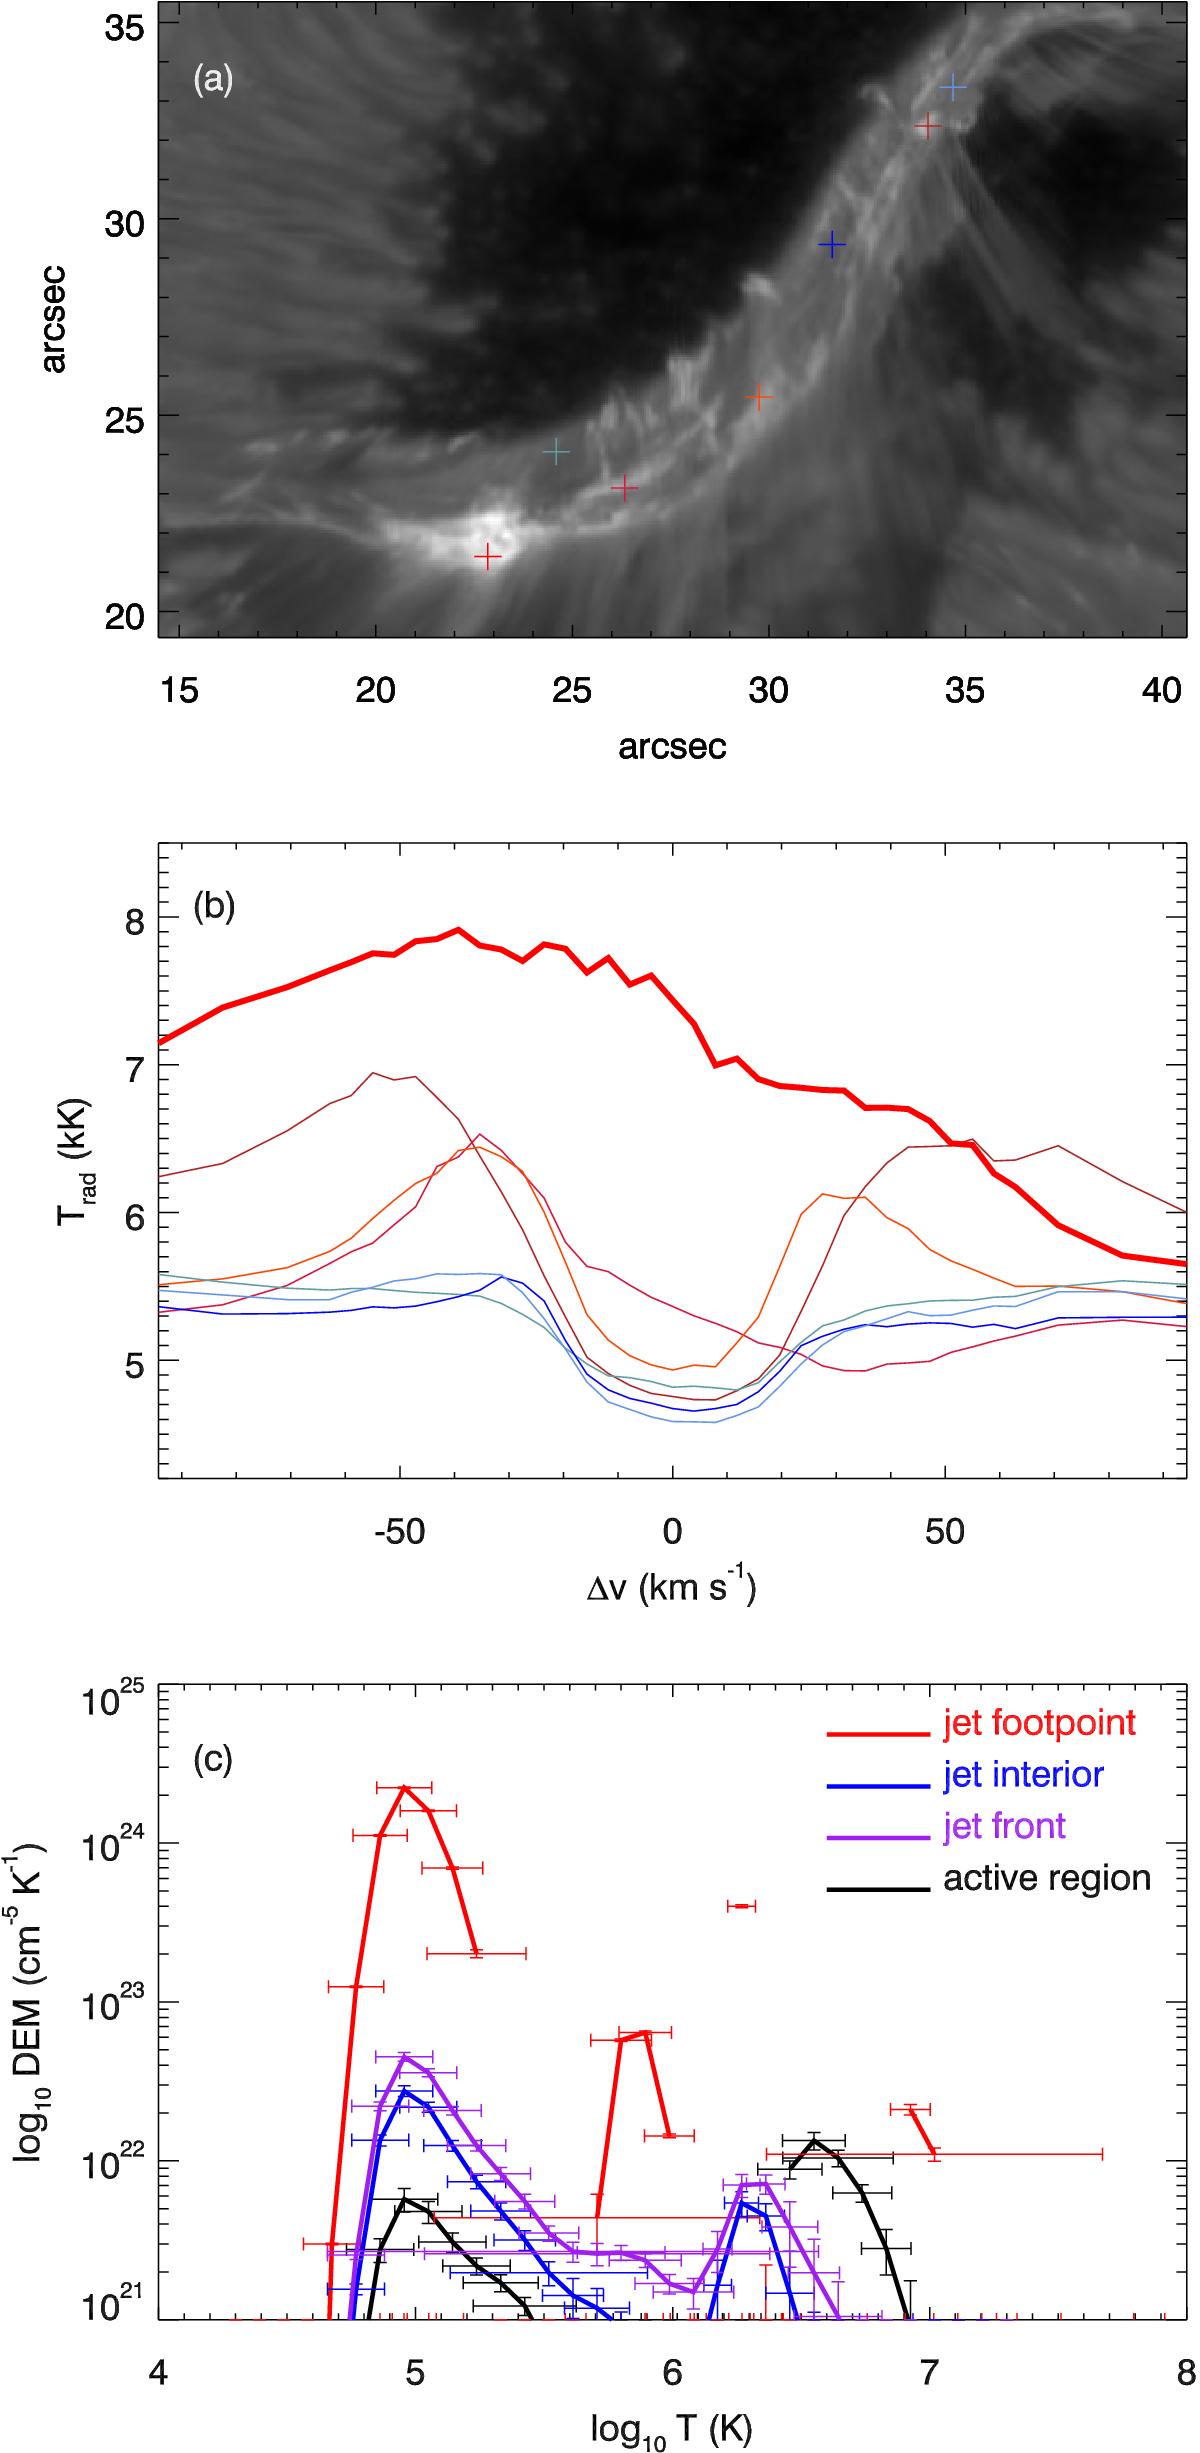
Top: Hα image of the LB at Δv = −50 km s-1; locations of the line profiles in the middle panel are indicated by plus-symbols. Middle: typical Hα profiles in the dark part of the light bridge (shades of blue), and typical profiles in the bright jet footpoints (shades of red). The thick red curve is the profile of the pixel labeled 1 in Fig. 2. Bottom: DEM distribution for the pixels labeled 1–3 in Fig. 2 and an average active region area.
Current usage metrics show cumulative count of Article Views (full-text article views including HTML views, PDF and ePub downloads, according to the available data) and Abstracts Views on Vision4Press platform.
Data correspond to usage on the plateform after 2015. The current usage metrics is available 48-96 hours after online publication and is updated daily on week days.
Initial download of the metrics may take a while.