Fig. 4
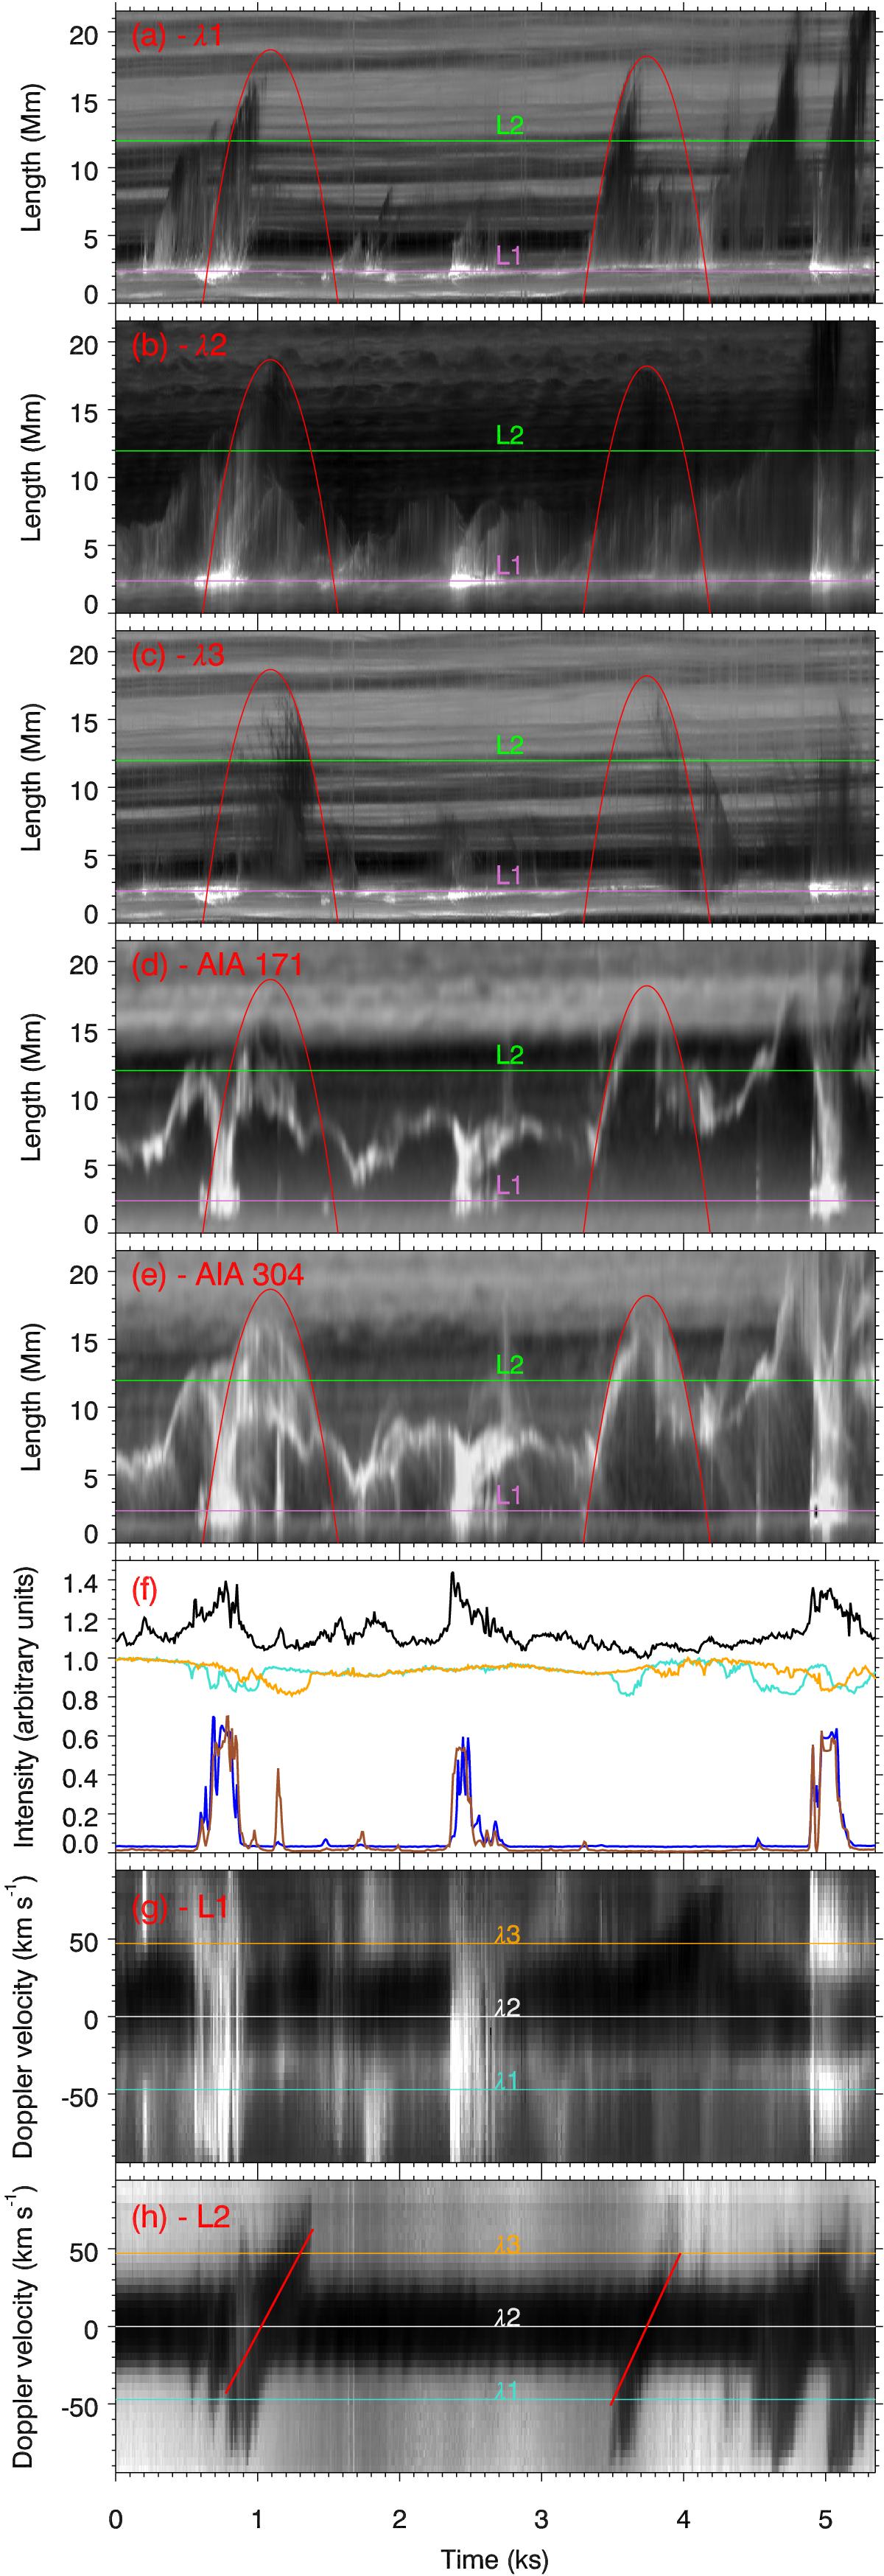
Panels a)–c): time-slices (s-t plots) along the red trajectory in Fig. 1 for Hα−50 km s-1a), Hα 0 km s-1b), Hα+50 km s-1c), and two AIA channels d)–e). The red parabolas are fits to Hα jet fronts. Panel f): normalized light curves for Hα at λ1 at location L2 (turquoise), Hα at λ3 at L2 (orange), Hα at λ1 at L1 (black), AIA 171 at L1 (blue), and AIA 304 at L1 (brown). Panels g)–h): time evolution of the Hα spectrum along the lines labeled L1 and L2 in panels a)–e). The lines labeled λ1–λ3 are the wavelengths for which a time-slice is shown in panels a)–c). The red lines in panel h) are fits to the Doppler shift of the absorbing feature associated with a jet.
Current usage metrics show cumulative count of Article Views (full-text article views including HTML views, PDF and ePub downloads, according to the available data) and Abstracts Views on Vision4Press platform.
Data correspond to usage on the plateform after 2015. The current usage metrics is available 48-96 hours after online publication and is updated daily on week days.
Initial download of the metrics may take a while.