Fig. 2
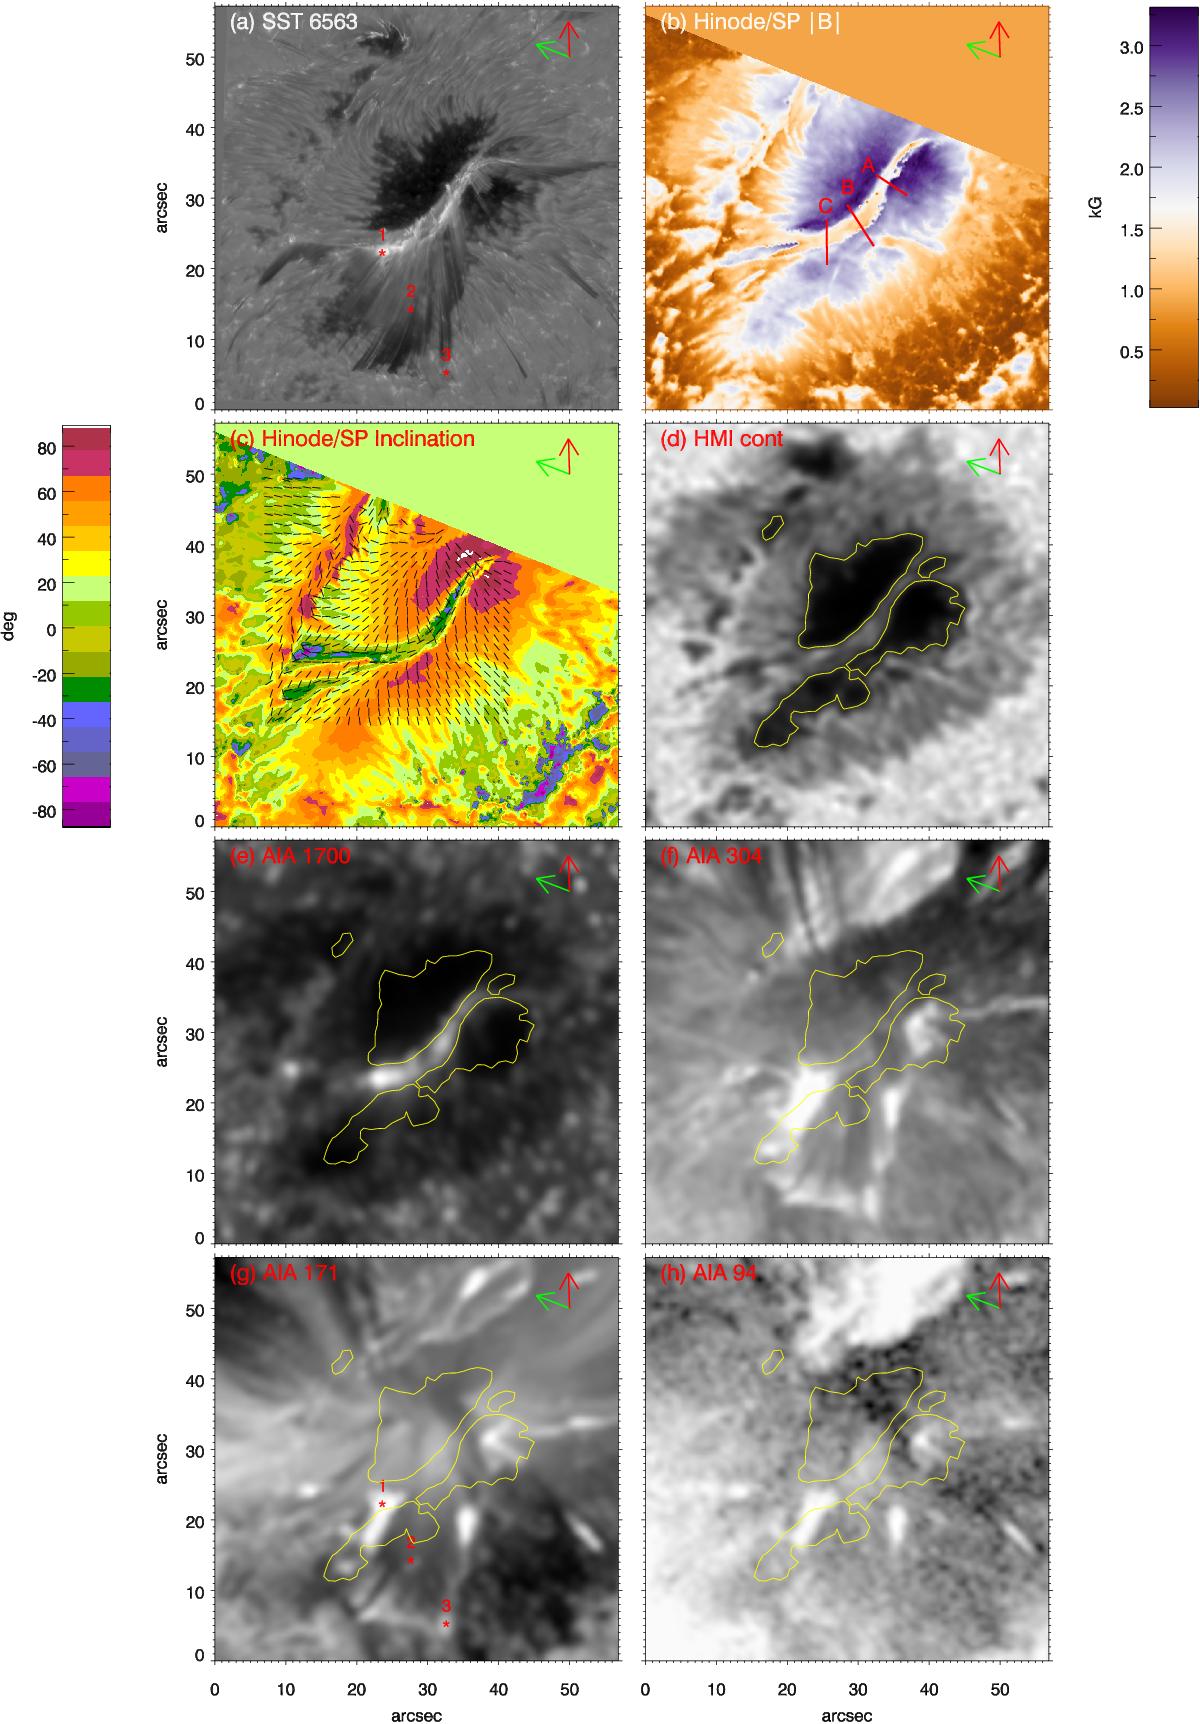
a) Peacock jets in the blue wing of Hα; b) magnetic field strength | B |. The lines A, B, and C refer to Fig. 3; c) magnetic field inclination with respect to the solar vertical and the direction of the horizontal component of the magnetic field (line segments). Panels d)–h) show images in the different AIA filters co-temporal with the Hα image. The yellow contour outlines the umbra. The numbered stars indicate points whose DEM is shown in panel c) of Fig. 7. This figure is accompanied by an online animation where the single Hinode SP scan b) is replaced by the temporal evolution of the HMI magnetograms and the inclination map c) by AIA 1600.
Current usage metrics show cumulative count of Article Views (full-text article views including HTML views, PDF and ePub downloads, according to the available data) and Abstracts Views on Vision4Press platform.
Data correspond to usage on the plateform after 2015. The current usage metrics is available 48-96 hours after online publication and is updated daily on week days.
Initial download of the metrics may take a while.