Fig. 1
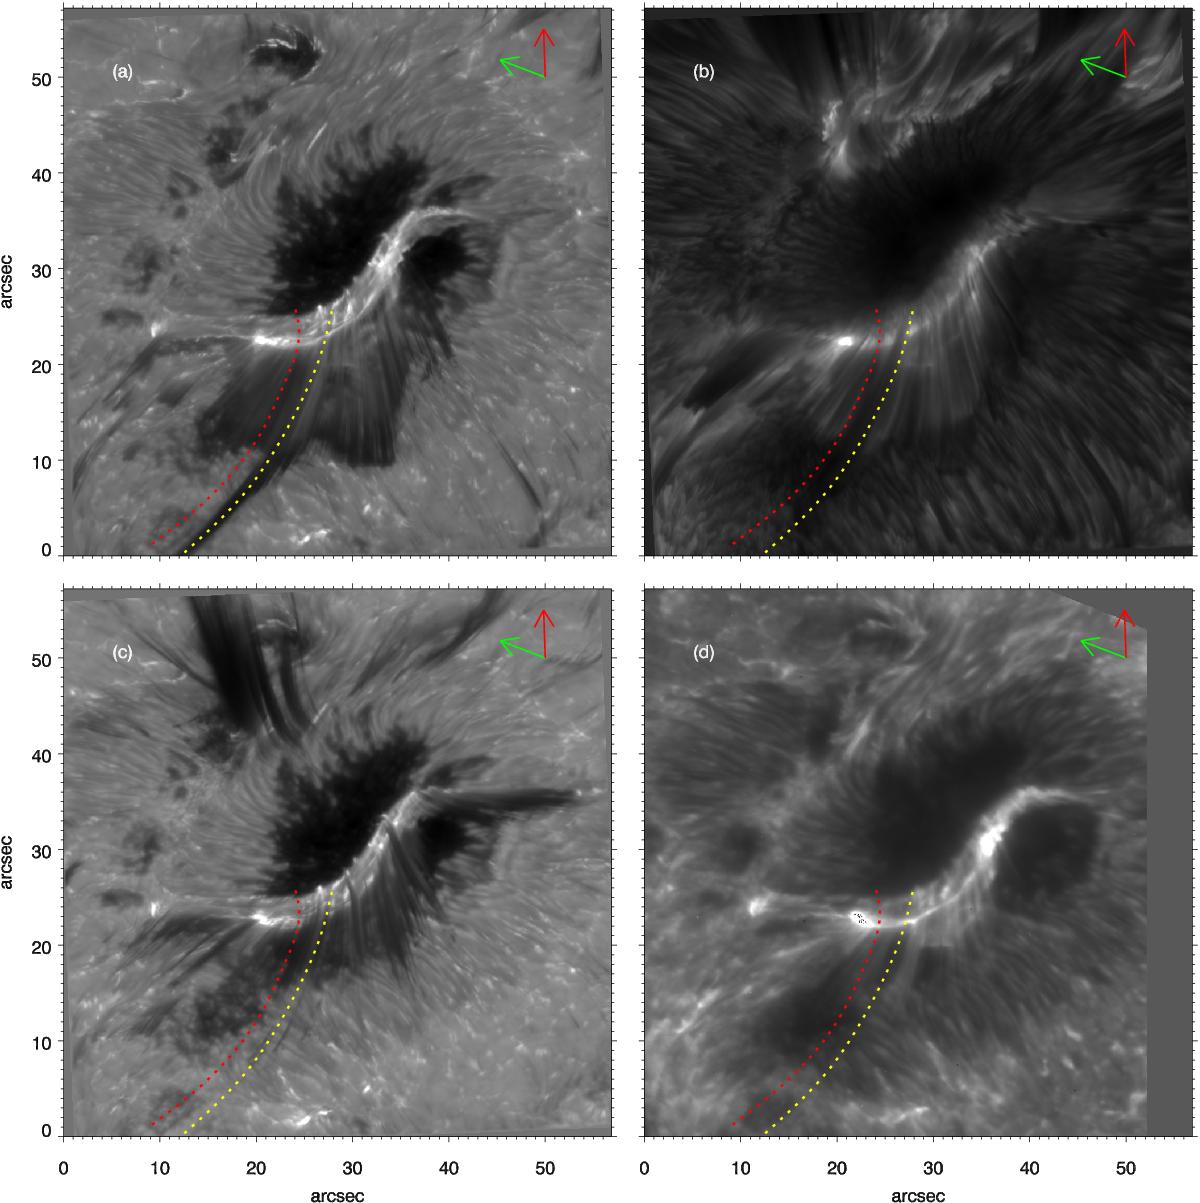
Peacock jets observed in the Hα line on 2013 June 5 at 9:23 UT. a) Blue wing image at Δλ = −45 km s-1; b) the line core; c) red wing image at Δλ = 45 km s-1; d) co-temporal wide-band image in the SOT Ca ii H filter. The red and yellow dashed curves are the trajectories of the jets shown in Figs. 4 and 5. The red and green arrows point toward the solar disk center and the solar north pole, respectively. This figure is accompanied by an online animation that shows the temporal evolution of panels a)–c).
Current usage metrics show cumulative count of Article Views (full-text article views including HTML views, PDF and ePub downloads, according to the available data) and Abstracts Views on Vision4Press platform.
Data correspond to usage on the plateform after 2015. The current usage metrics is available 48-96 hours after online publication and is updated daily on week days.
Initial download of the metrics may take a while.