Fig. 8
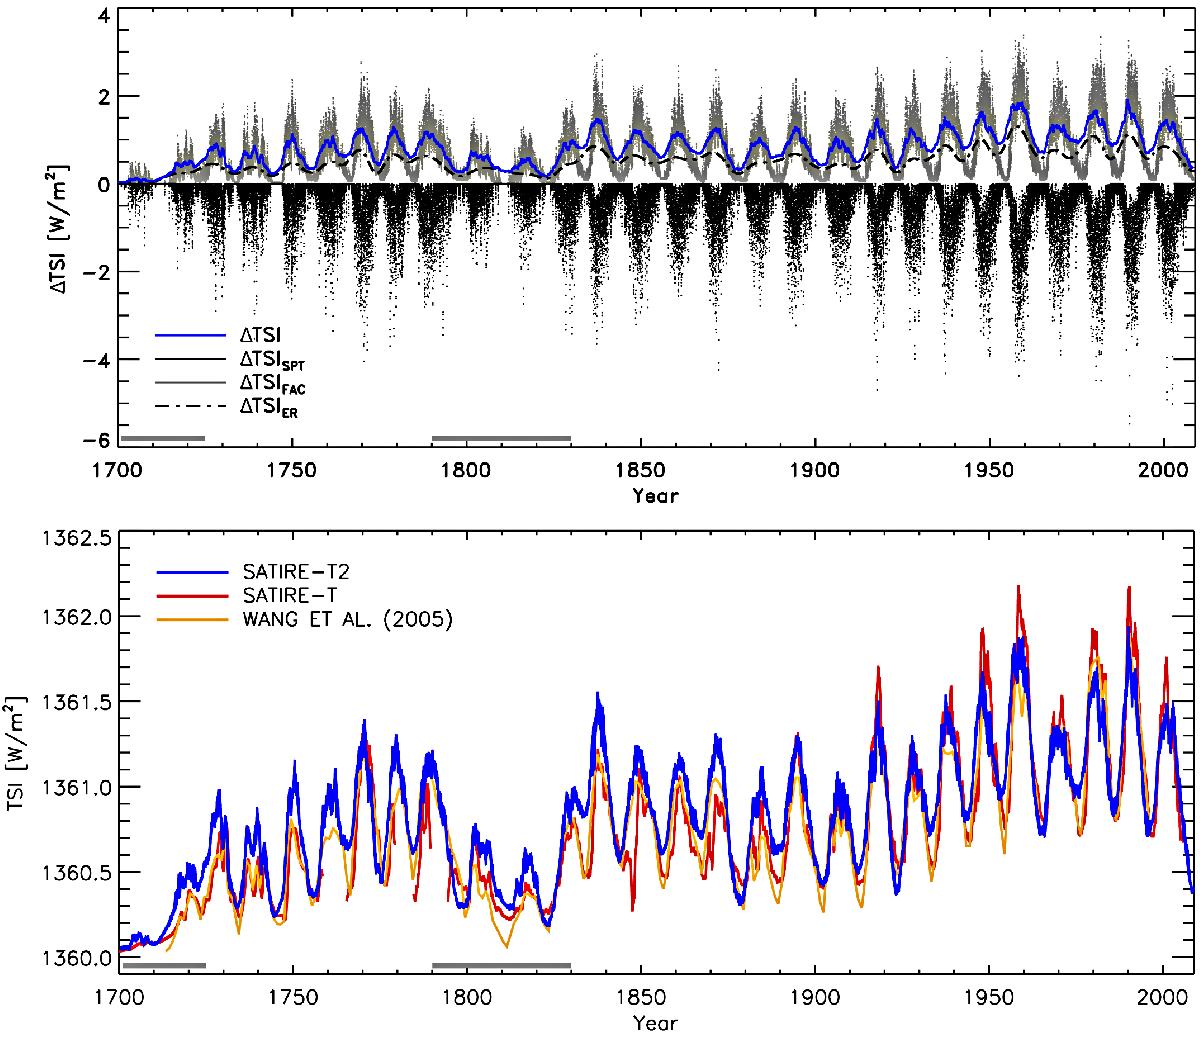
Top: change in TSI relative to the quiet Sun value, ΔTSI, smoothed over a year (blue) based on the semi-synthetic sunspot group record SGR300. The contribution of spots, faculae, and ephemeral regions are also shown on a daily basis as grey dots, black dots and the dot-dashed black curve, respectively. Bottom: comparison between the TSI reconstructions from SATIRE-T2 using SGR300 and SGR301 (both based on Rg as input (blue), and SATIRE-T (red) smoothed over 1 yr, and the yearly values of the reconstruction from Wang et al. (2005, orange). The grey bars at the bottom indicate the times when the statistical relationships of SATIRE-T2 have been extrapolated beyond the range of observations on which they are based.
Current usage metrics show cumulative count of Article Views (full-text article views including HTML views, PDF and ePub downloads, according to the available data) and Abstracts Views on Vision4Press platform.
Data correspond to usage on the plateform after 2015. The current usage metrics is available 48-96 hours after online publication and is updated daily on week days.
Initial download of the metrics may take a while.