Free Access
Fig. 6
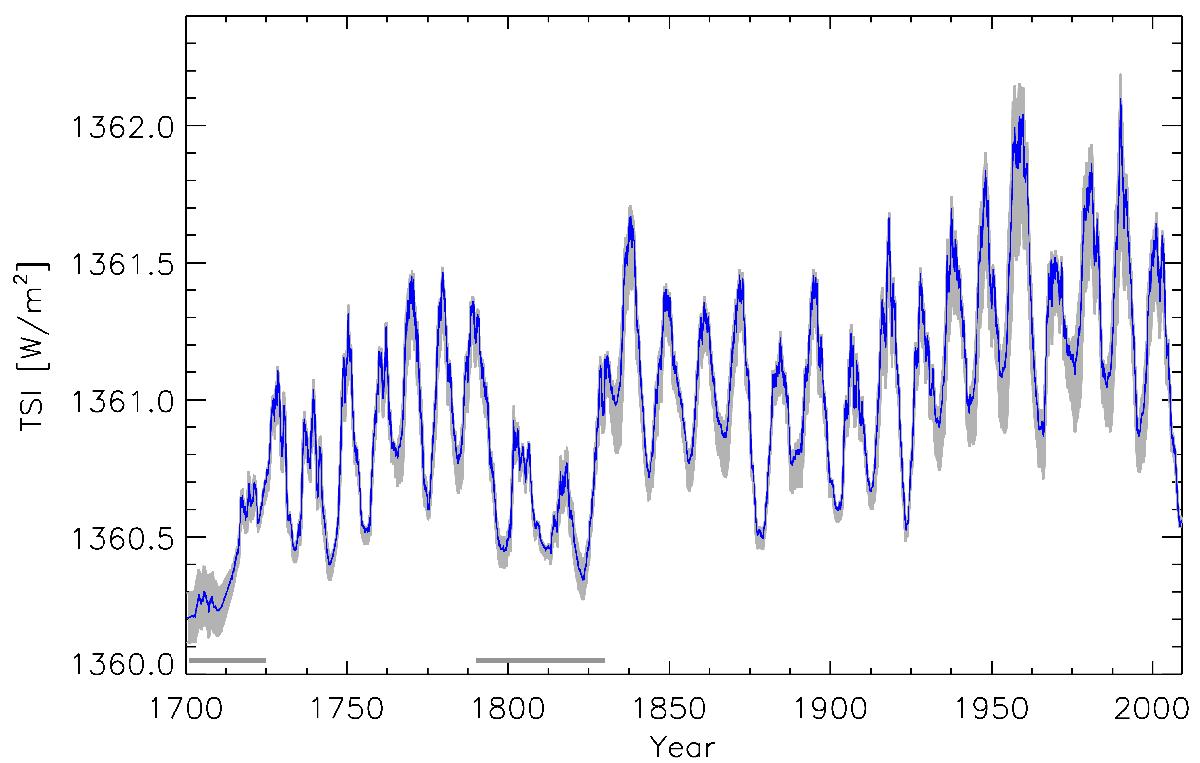
TSI reconstruction based on Rg smoothed over 1 yr (blue) and the uncertainty range (grey) based on the uncertainty in the parameter fitting (see Sect. 3.2). The grey bars at the bottom indicate the times when the statistical relationships have been extrapolated beyond the range of observations on which they are based.
Current usage metrics show cumulative count of Article Views (full-text article views including HTML views, PDF and ePub downloads, according to the available data) and Abstracts Views on Vision4Press platform.
Data correspond to usage on the plateform after 2015. The current usage metrics is available 48-96 hours after online publication and is updated daily on week days.
Initial download of the metrics may take a while.