Fig. 5
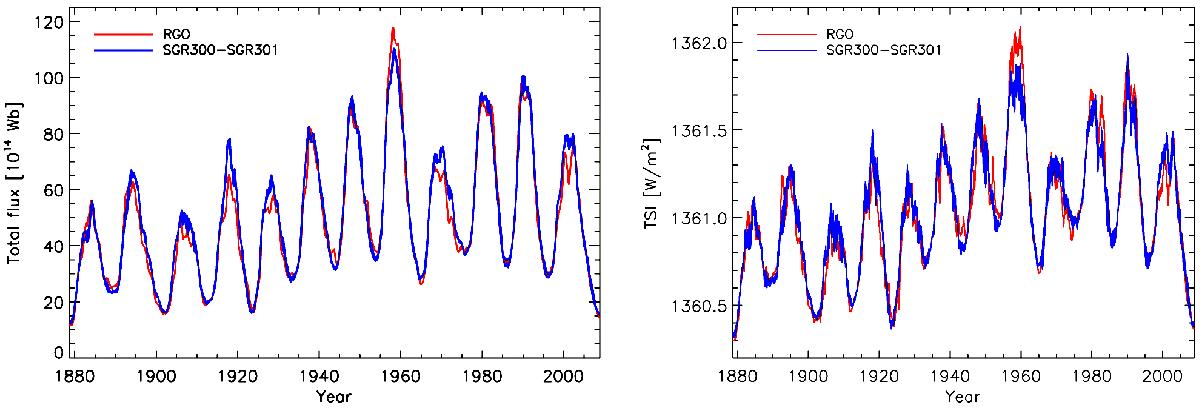
Comparison between the 1-yr smoothed total magnetic flux (left) and TSI (right) reconstructions based on the RGO-SOON sunspot group record (red), and the semi-synthetic sunspot group record (blue). The thickness of the blue line indicates the range of values between two reconstructions based on the semi-synthetic records SGR300 and SGR301.
Current usage metrics show cumulative count of Article Views (full-text article views including HTML views, PDF and ePub downloads, according to the available data) and Abstracts Views on Vision4Press platform.
Data correspond to usage on the plateform after 2015. The current usage metrics is available 48-96 hours after online publication and is updated daily on week days.
Initial download of the metrics may take a while.