Free Access
Fig. 1
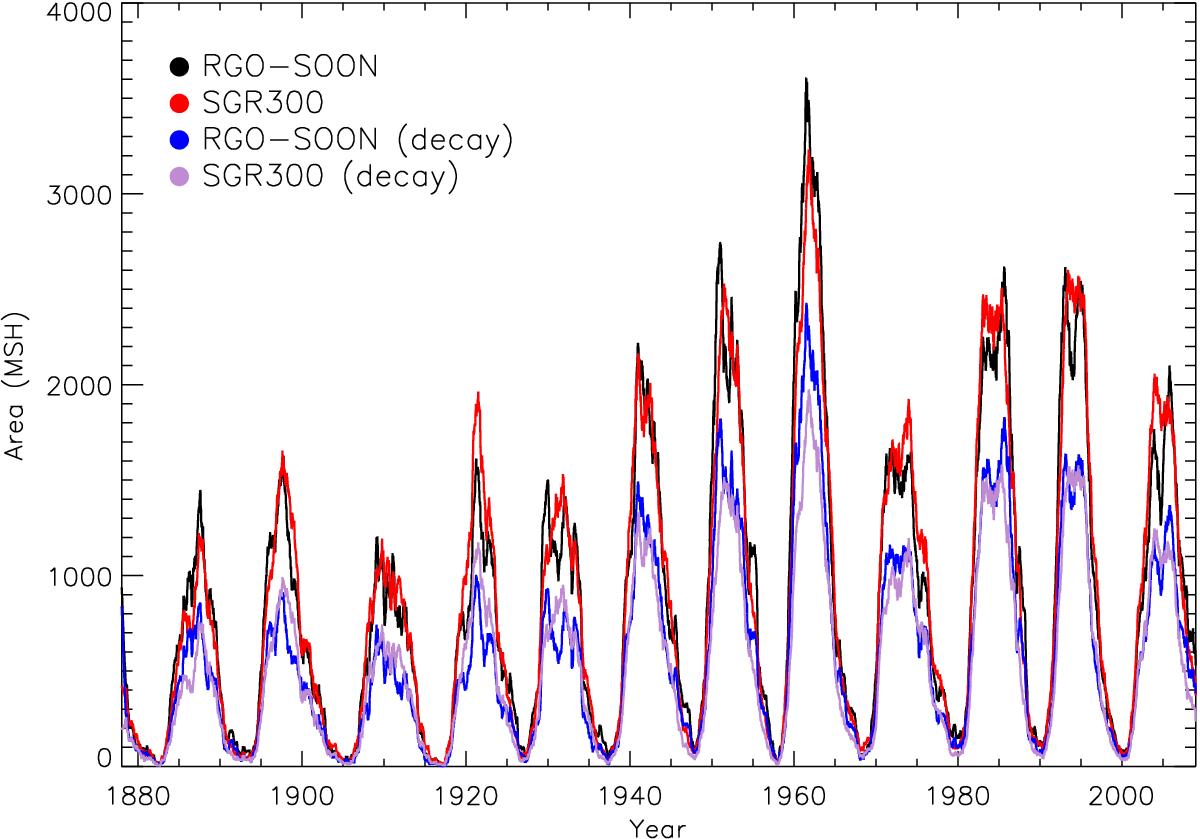
Daily sunspot group area on the visible side of the Sun as recorded in the RGO-SOON data set (black), and that obtained from the synthetic record SGR300 within ± 70° from the central meridian (red). The same is plotted but taking only the decay phase of sunspot groups in the RGO-SOON data set (blue) and SGR300 (magenta).
Current usage metrics show cumulative count of Article Views (full-text article views including HTML views, PDF and ePub downloads, according to the available data) and Abstracts Views on Vision4Press platform.
Data correspond to usage on the plateform after 2015. The current usage metrics is available 48-96 hours after online publication and is updated daily on week days.
Initial download of the metrics may take a while.