Free Access
Fig. 9
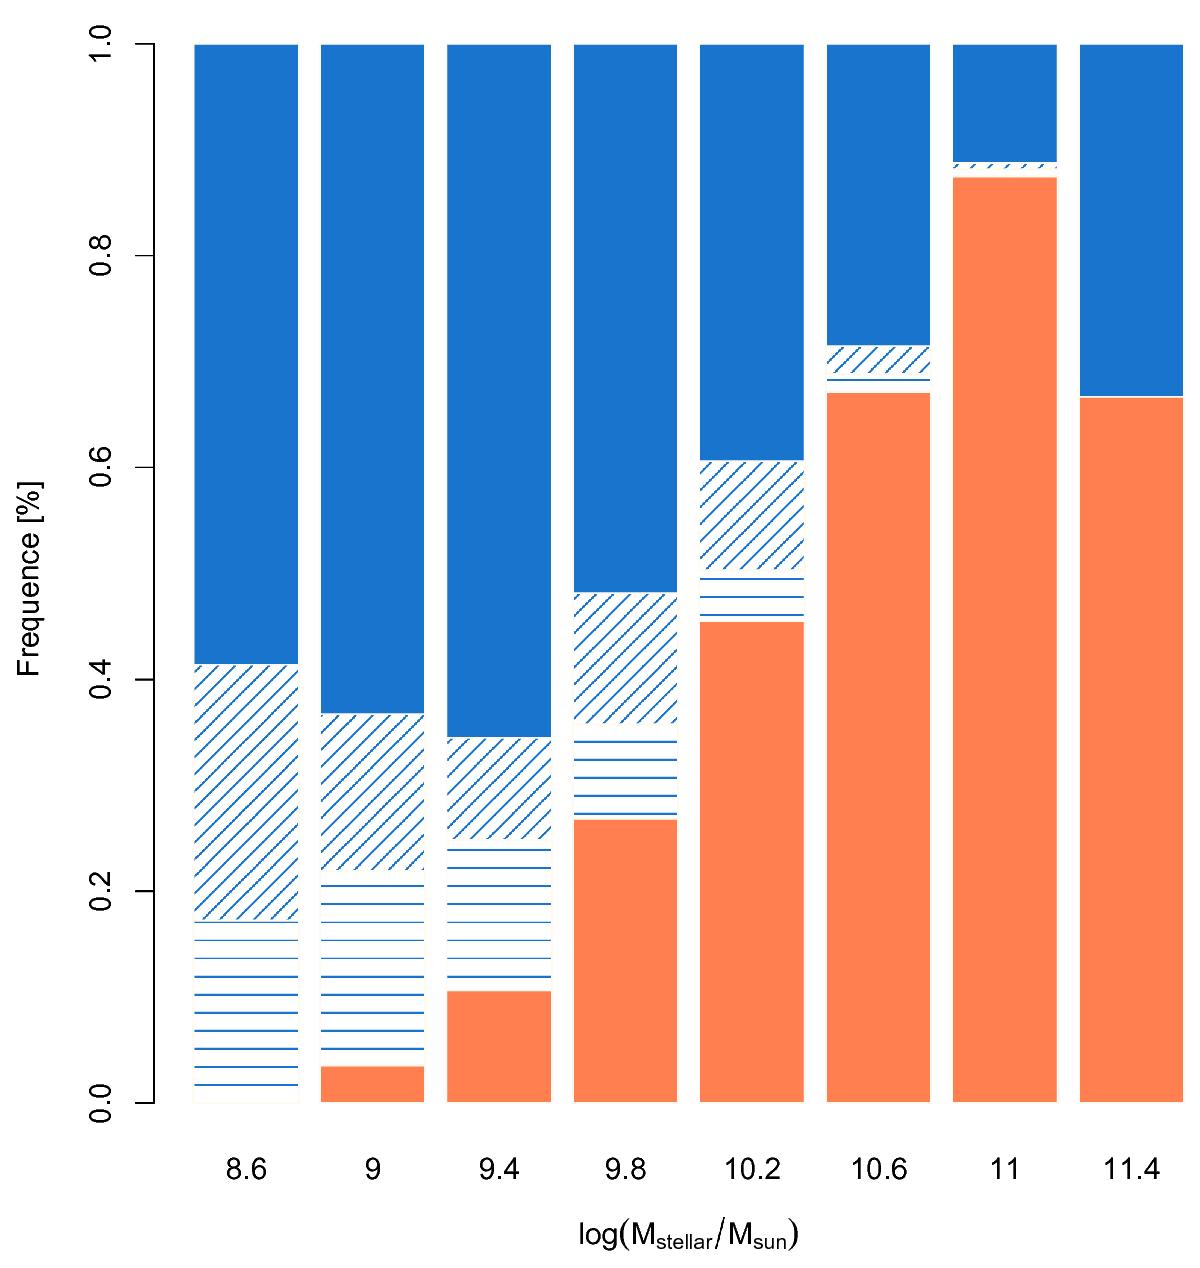
Fraction of star-forming (blue bars) and quiescent galaxies (red bars) in the 0.07 <z< 0.1 sample as a function of the stellar mass. Weak-line galaxies are represented as diagonal dashes and galaxies with fewer than three emission lines detected are shown with horizontal dashes.
Current usage metrics show cumulative count of Article Views (full-text article views including HTML views, PDF and ePub downloads, according to the available data) and Abstracts Views on Vision4Press platform.
Data correspond to usage on the plateform after 2015. The current usage metrics is available 48-96 hours after online publication and is updated daily on week days.
Initial download of the metrics may take a while.