Fig. 8
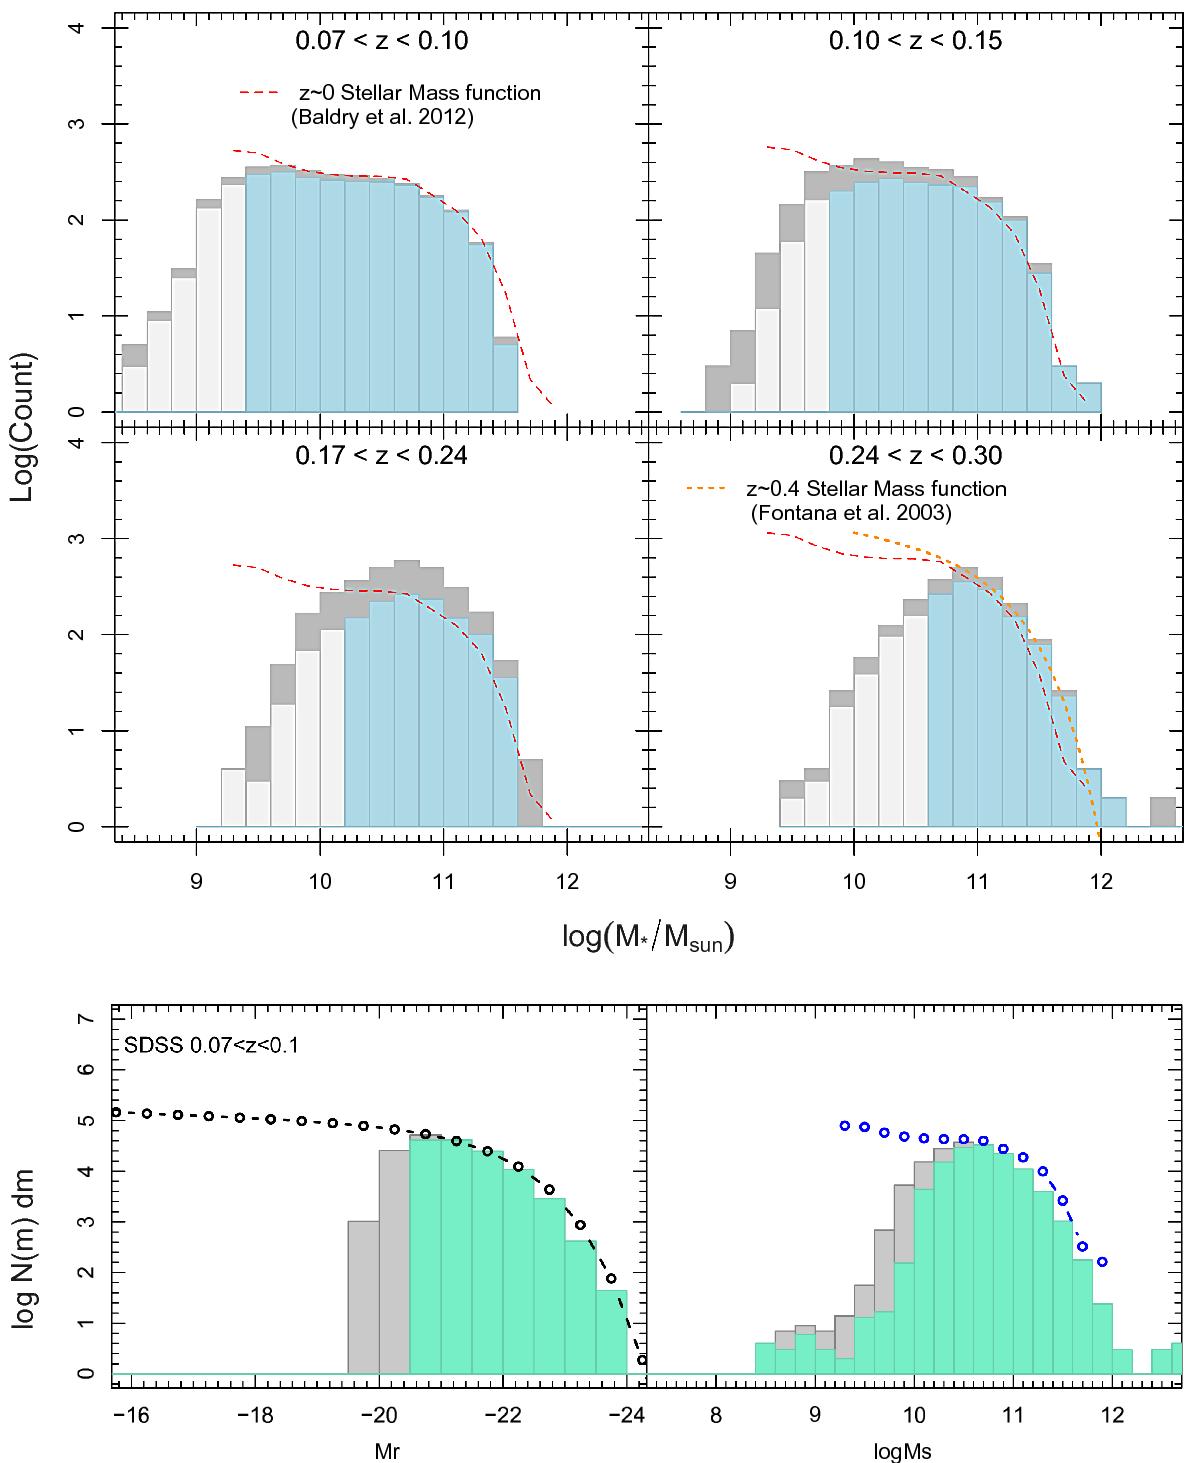
Upper panel: stellar mass distribution of the four redshift bins. The stellar mass histograms for each sample are shown before (dark gray) and after (light gray) the quality control. The stellar mass distributions at the end of the data analysis are compared to the local stellar mass function from Baldry et al. (2012). The light blue histograms show the stellar mass intervals for which the samples are representative. Lower panel: absolute magnitude and stellar mass distribution of SDSS galaxies in the redshift range 0.07 <z< 0.1. The gray histogram corresponds to all the galaxies within the redshift range above the SDSS magnitude limit mr< 17.7. The green histogram corresponds to the distribution of a volume-limited sample in the same redshift range and Mr< −20.62 (Mr limit at z ~ 0.1 for the SDSS). The Mr and stellar mass distributions were compared to the local luminosity function from Loveday et al. (2012; back circle line in right panel) and local stellar mass function from Baldry et al. (2012; blue circle line in left panel), respectively.
Current usage metrics show cumulative count of Article Views (full-text article views including HTML views, PDF and ePub downloads, according to the available data) and Abstracts Views on Vision4Press platform.
Data correspond to usage on the plateform after 2015. The current usage metrics is available 48-96 hours after online publication and is updated daily on week days.
Initial download of the metrics may take a while.