Fig. 7
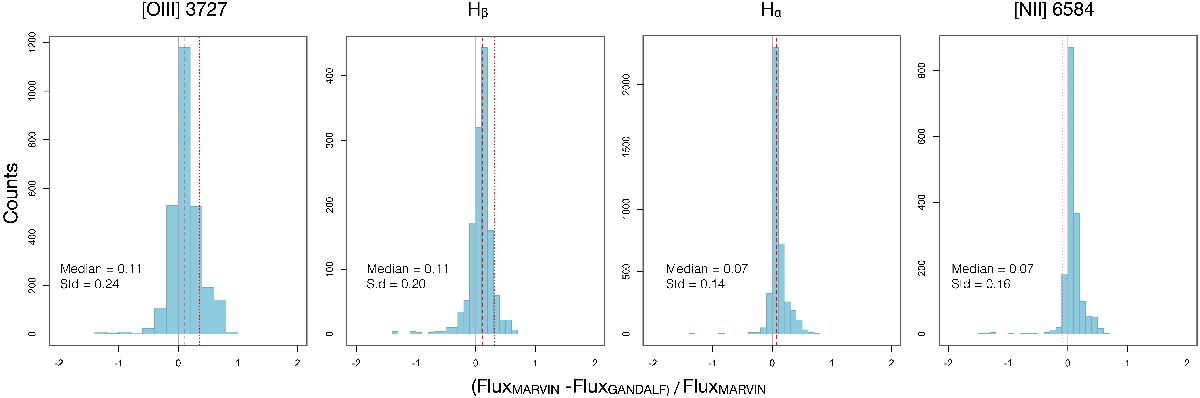
Comparison between the flux measured by MARVIN and GANDALF for the spectra in sample 0.1 <z< 0.15. Only lines detected above a S/N threshold of 7 by both codes have been selected. Below this S/N threshold the fluxes are systematically overestimated, see discussion in the text. The false detections have been excluded in the comparison.The dashed and dotted lines are the median and standard deviation of the distributions, respectively.
Current usage metrics show cumulative count of Article Views (full-text article views including HTML views, PDF and ePub downloads, according to the available data) and Abstracts Views on Vision4Press platform.
Data correspond to usage on the plateform after 2015. The current usage metrics is available 48-96 hours after online publication and is updated daily on week days.
Initial download of the metrics may take a while.