Fig. 6
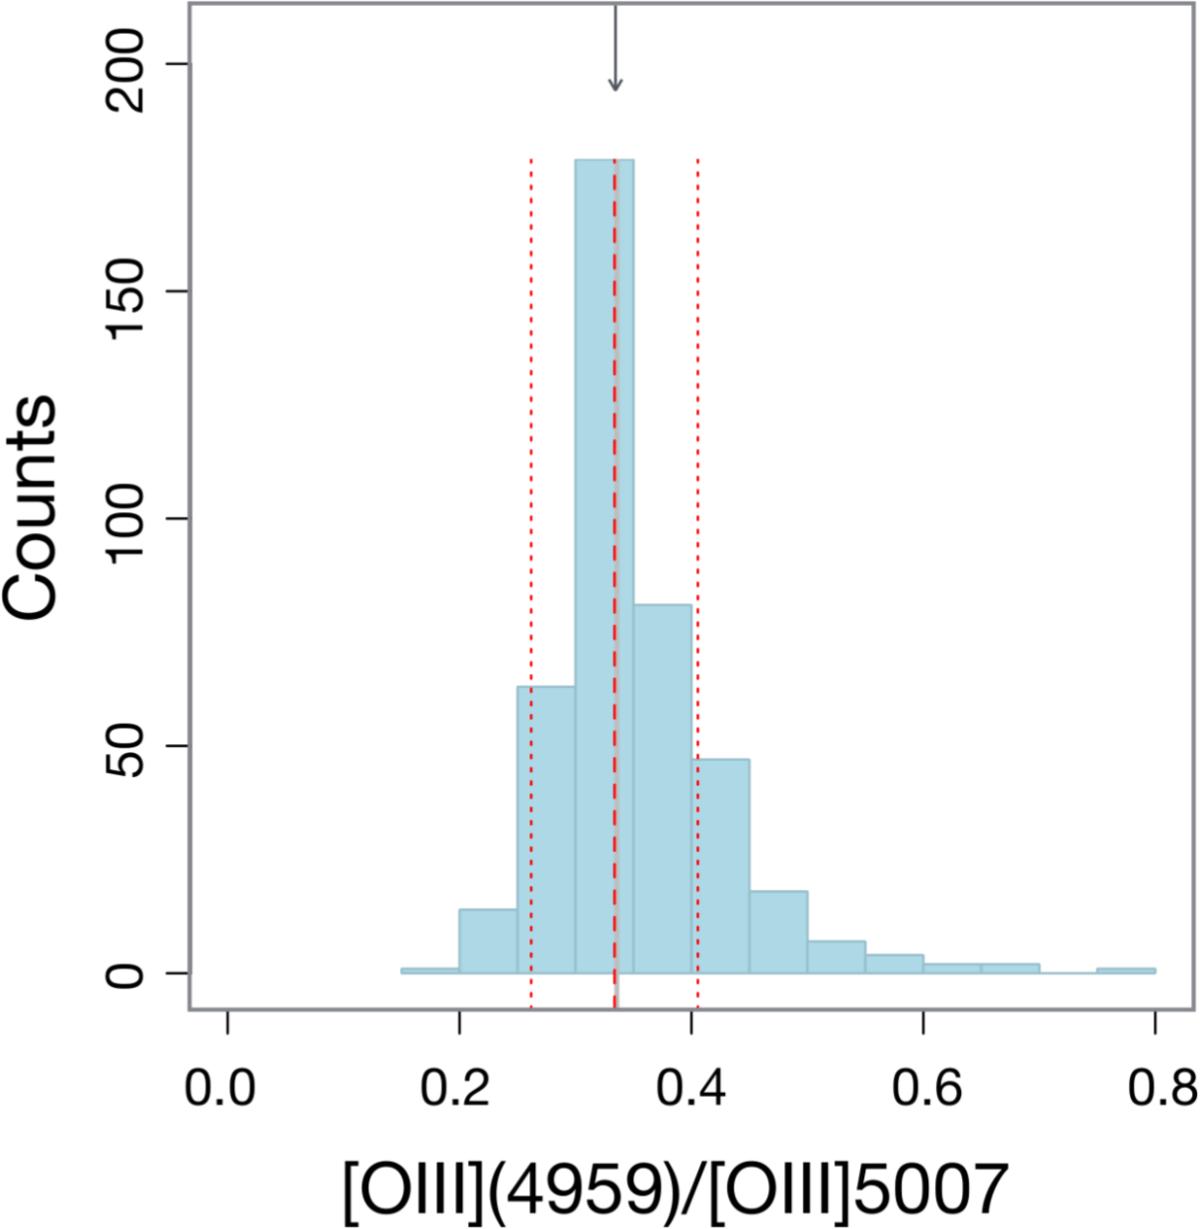
Distribution of observed ratio of [O iii] λ4959/[O iii] λ5007 in 0.10 <z< 0.15 sample for S/Nline> 7. The solid arrow corresponds to the theoretical ratio of 1/2.98 (Storey & Zeippen 2000). The median and the 68th percentiles are represented as the dashed and dotted red lines, respectively. The median flux ratio is 0.333 with a standard deviation of 0.07, within 1 per cent of the theoretical value.
Current usage metrics show cumulative count of Article Views (full-text article views including HTML views, PDF and ePub downloads, according to the available data) and Abstracts Views on Vision4Press platform.
Data correspond to usage on the plateform after 2015. The current usage metrics is available 48-96 hours after online publication and is updated daily on week days.
Initial download of the metrics may take a while.