Fig. 4
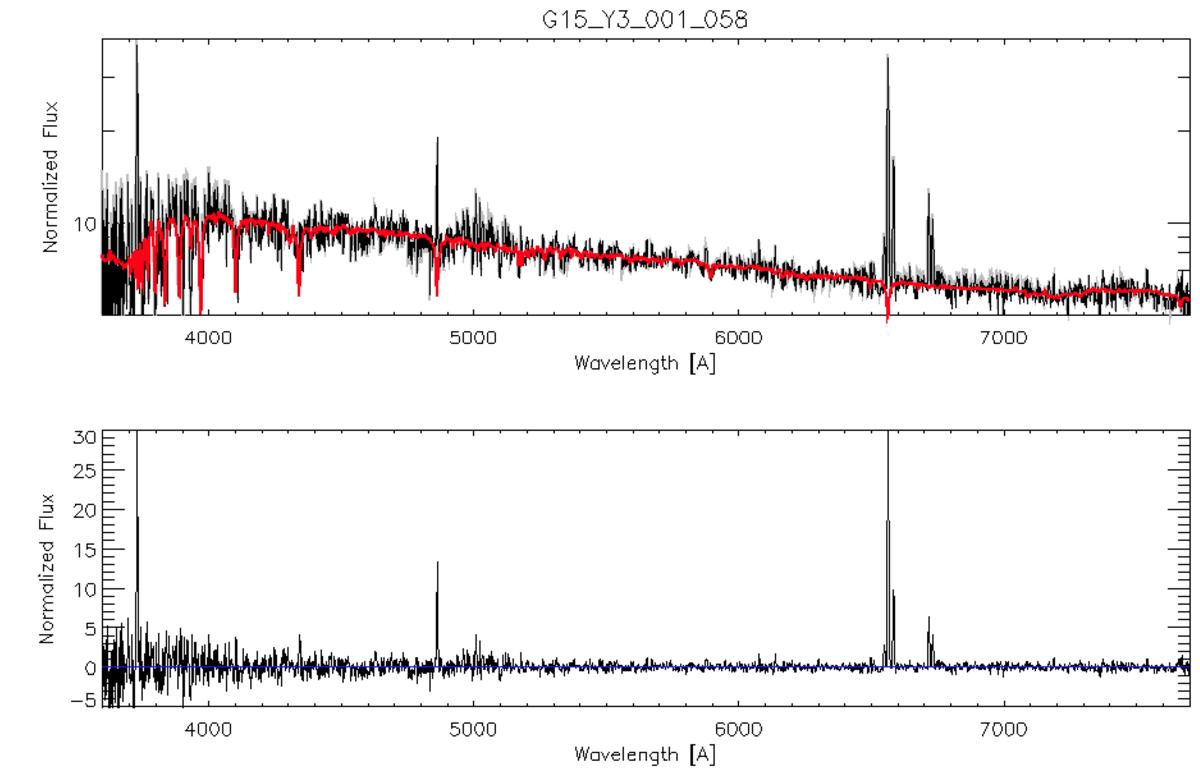
Typical accuracy of the stellar continuum subtraction. Top panel: raw (gray), after correcting the low-frequency residuals (black) and synthetic spectra for a typical sample target. The correction of the low-frequency residuals are typically <5%. In this spectrum the correction is hardly visible. The correction is visible around 7000 Å, corresponding to a region typically affected by sky subtraction residuals. Lower panel: residuals after subtracting the synthetic spectrum.
Current usage metrics show cumulative count of Article Views (full-text article views including HTML views, PDF and ePub downloads, according to the available data) and Abstracts Views on Vision4Press platform.
Data correspond to usage on the plateform after 2015. The current usage metrics is available 48-96 hours after online publication and is updated daily on week days.
Initial download of the metrics may take a while.