Fig. 3
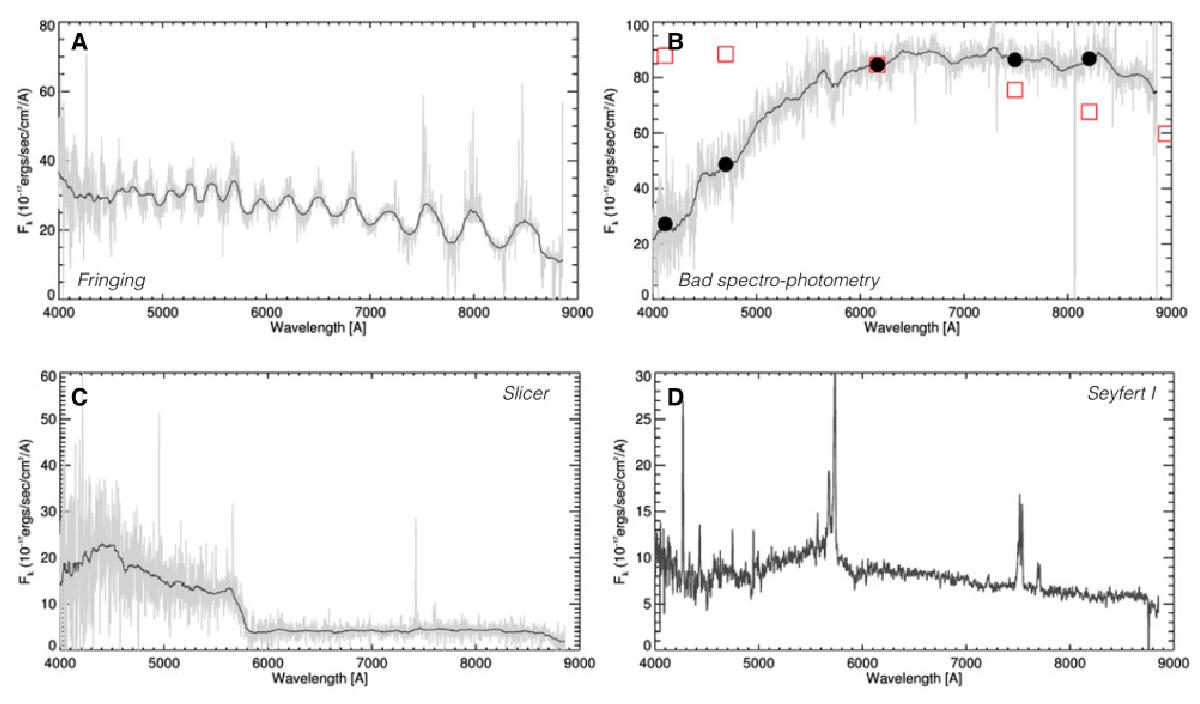
Example spectra representing our four quality flags. Panel A) shows an example of a fringed spectrum. A spectrum with failed spectrophotometry is shown in panel B), wherein the red open squares are the fluxes estimated from the SDSS photometry inside the fibre aperture. Panel C) shows a spectrum with clear splicing problems around observed frame 5700 Å, where the blue and red spectra have been unsuccessfully joined. An example spectrum with broad hydrogen emission lines classified as Seyfert I is shown in panel D).
Current usage metrics show cumulative count of Article Views (full-text article views including HTML views, PDF and ePub downloads, according to the available data) and Abstracts Views on Vision4Press platform.
Data correspond to usage on the plateform after 2015. The current usage metrics is available 48-96 hours after online publication and is updated daily on week days.
Initial download of the metrics may take a while.