Fig. 13
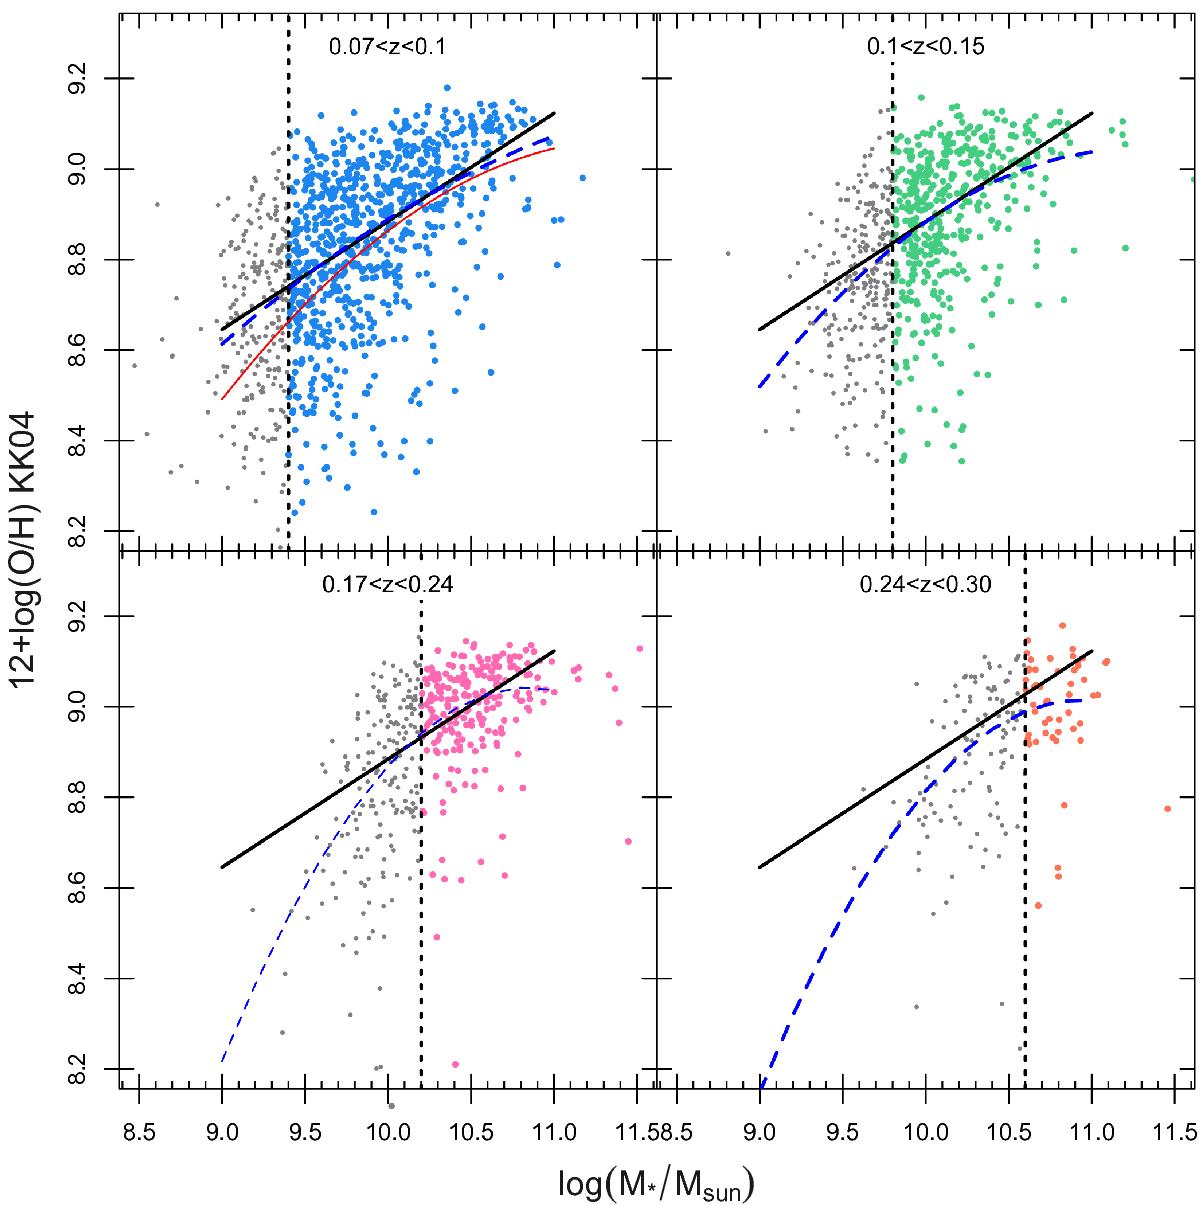
Evolution of the M − Z relation within the GAMA survey from z = 0 to z = 0.3. The four panels show the M − Z relation for the four samples (same color codes as Fig. 1). Sources below and above the stellar mass limit are shown as open and filled symbols, respectively. The solid line shows the best fit to the lowest redshift sample. The samples have also been fitted with a second-order polynomial regardless of the representativity limit. We note that the apparent evolution of the shape of the M − Z relation can be fully explained with this selection effect.
Current usage metrics show cumulative count of Article Views (full-text article views including HTML views, PDF and ePub downloads, according to the available data) and Abstracts Views on Vision4Press platform.
Data correspond to usage on the plateform after 2015. The current usage metrics is available 48-96 hours after online publication and is updated daily on week days.
Initial download of the metrics may take a while.