Fig. 12
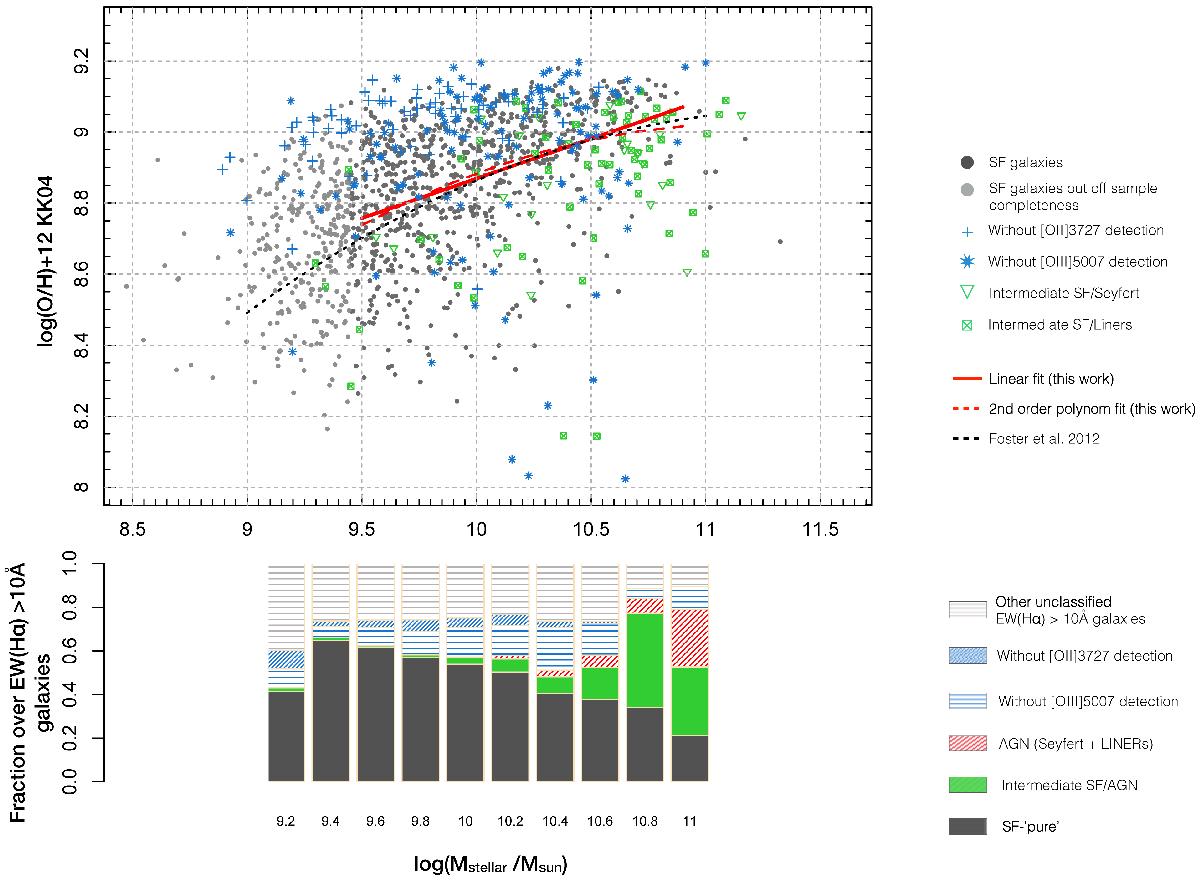
Upper panel: local M − Z relation in the 0.07 <z< 0.1 redshift bin for galaxies classified as pure star-forming galaxies (gray dots) using the KK04 metallicity calibration. The red solid and red dashed line are the linear and second-order polynomial fit to the data, respectively, within the representativity limit of the sample log M∗> 9.4. The blue symbols are galaxies without [O ii] detections (cross) and [O iii] (star). Their metallicities correspond to lower limits estimated from upper limits of the [O ii]λ3727 and [O iii]λ5007 line fluxes. Composite SF-Seyfert and SF-LINERs are represented as green triangles and green cross-squares, respectively. Lower panel: fraction of each spectral type for galaxies verifying the emission-line classification, i.e., EW(Hα) > 10 Å (see Sect. 5.2) in the 0.07 <z< 0.1 sample as a function of the stellar mass. The pure star-forming galaxies shown in the upper panel are represented as a gray area. Composite SF-AGN and AGNs are represented as green and dashed red boxes. Weak-line galaxies, namely galaxies without [O ii]λ3727 and [O iii]λ5007 lines (see Sect. 5.2), are shown in blue. Unclassified galaxies are shown in gray.
Current usage metrics show cumulative count of Article Views (full-text article views including HTML views, PDF and ePub downloads, according to the available data) and Abstracts Views on Vision4Press platform.
Data correspond to usage on the plateform after 2015. The current usage metrics is available 48-96 hours after online publication and is updated daily on week days.
Initial download of the metrics may take a while.