Fig. 10
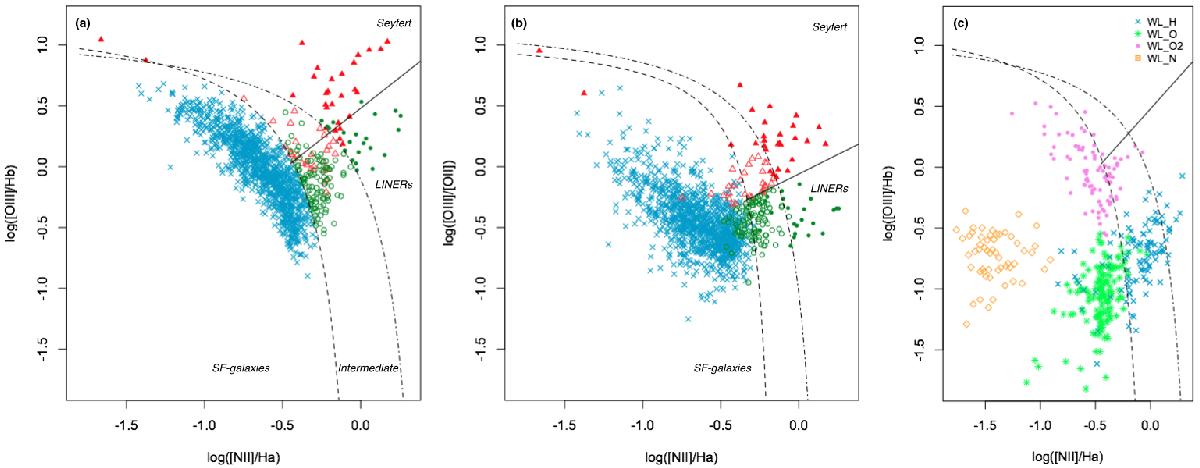
Panel a) BPT diagrams for the 0.07 <z< 0.1 strong-line galaxies. The symbol codes the classification of the targets according to their location in the BPT diagrams: AGN (filled symbols), intermediate (open symbols) and pure star-forming (stars).Targets above the dot-dashed line are AGN/LINER hosts (solid symbols) according to the theoretical separation of Kewley et al. (2006). This separation corresponds to the theoretical limit when assuming only stellar photoionizing radiation. The dashed line corresponds to the empirical limit between star-forming galaxies and AGN/LINERs from Kauffmann et al. (2003a). Galaxies falling between the two lines are composite SF-AGN galaxies. Below the Kauffmann et al. (2003a) line, galaxies are classified as pure star-forming galaxies. The solid line shows the separation between Seyfert and LINERs. The color codes the classification of intermediate and pure AGN into LINERs (green) and Seyferts (red) according to their location on the BPTO2 diagram. Panel b) The BPTO2 diagram for 0.07 <z< 0.1 sample. The symbols are the same as for panel a). This diagnostic diagram has been used to distinguish Seyferts from LINERs for galaxies classified as AGN in the BPT diagram. Panel c) BPT diagrams for the weak-line galaxies in the 0.07 <z< 0.1 sample. The symbols represent the spectral classification of the WLGs with WLG-H as blue crosses, WLG-O as green stars, WLG-O2 as violet circles, and WLG-OH as open red triangles.
Current usage metrics show cumulative count of Article Views (full-text article views including HTML views, PDF and ePub downloads, according to the available data) and Abstracts Views on Vision4Press platform.
Data correspond to usage on the plateform after 2015. The current usage metrics is available 48-96 hours after online publication and is updated daily on week days.
Initial download of the metrics may take a while.