Fig. 20
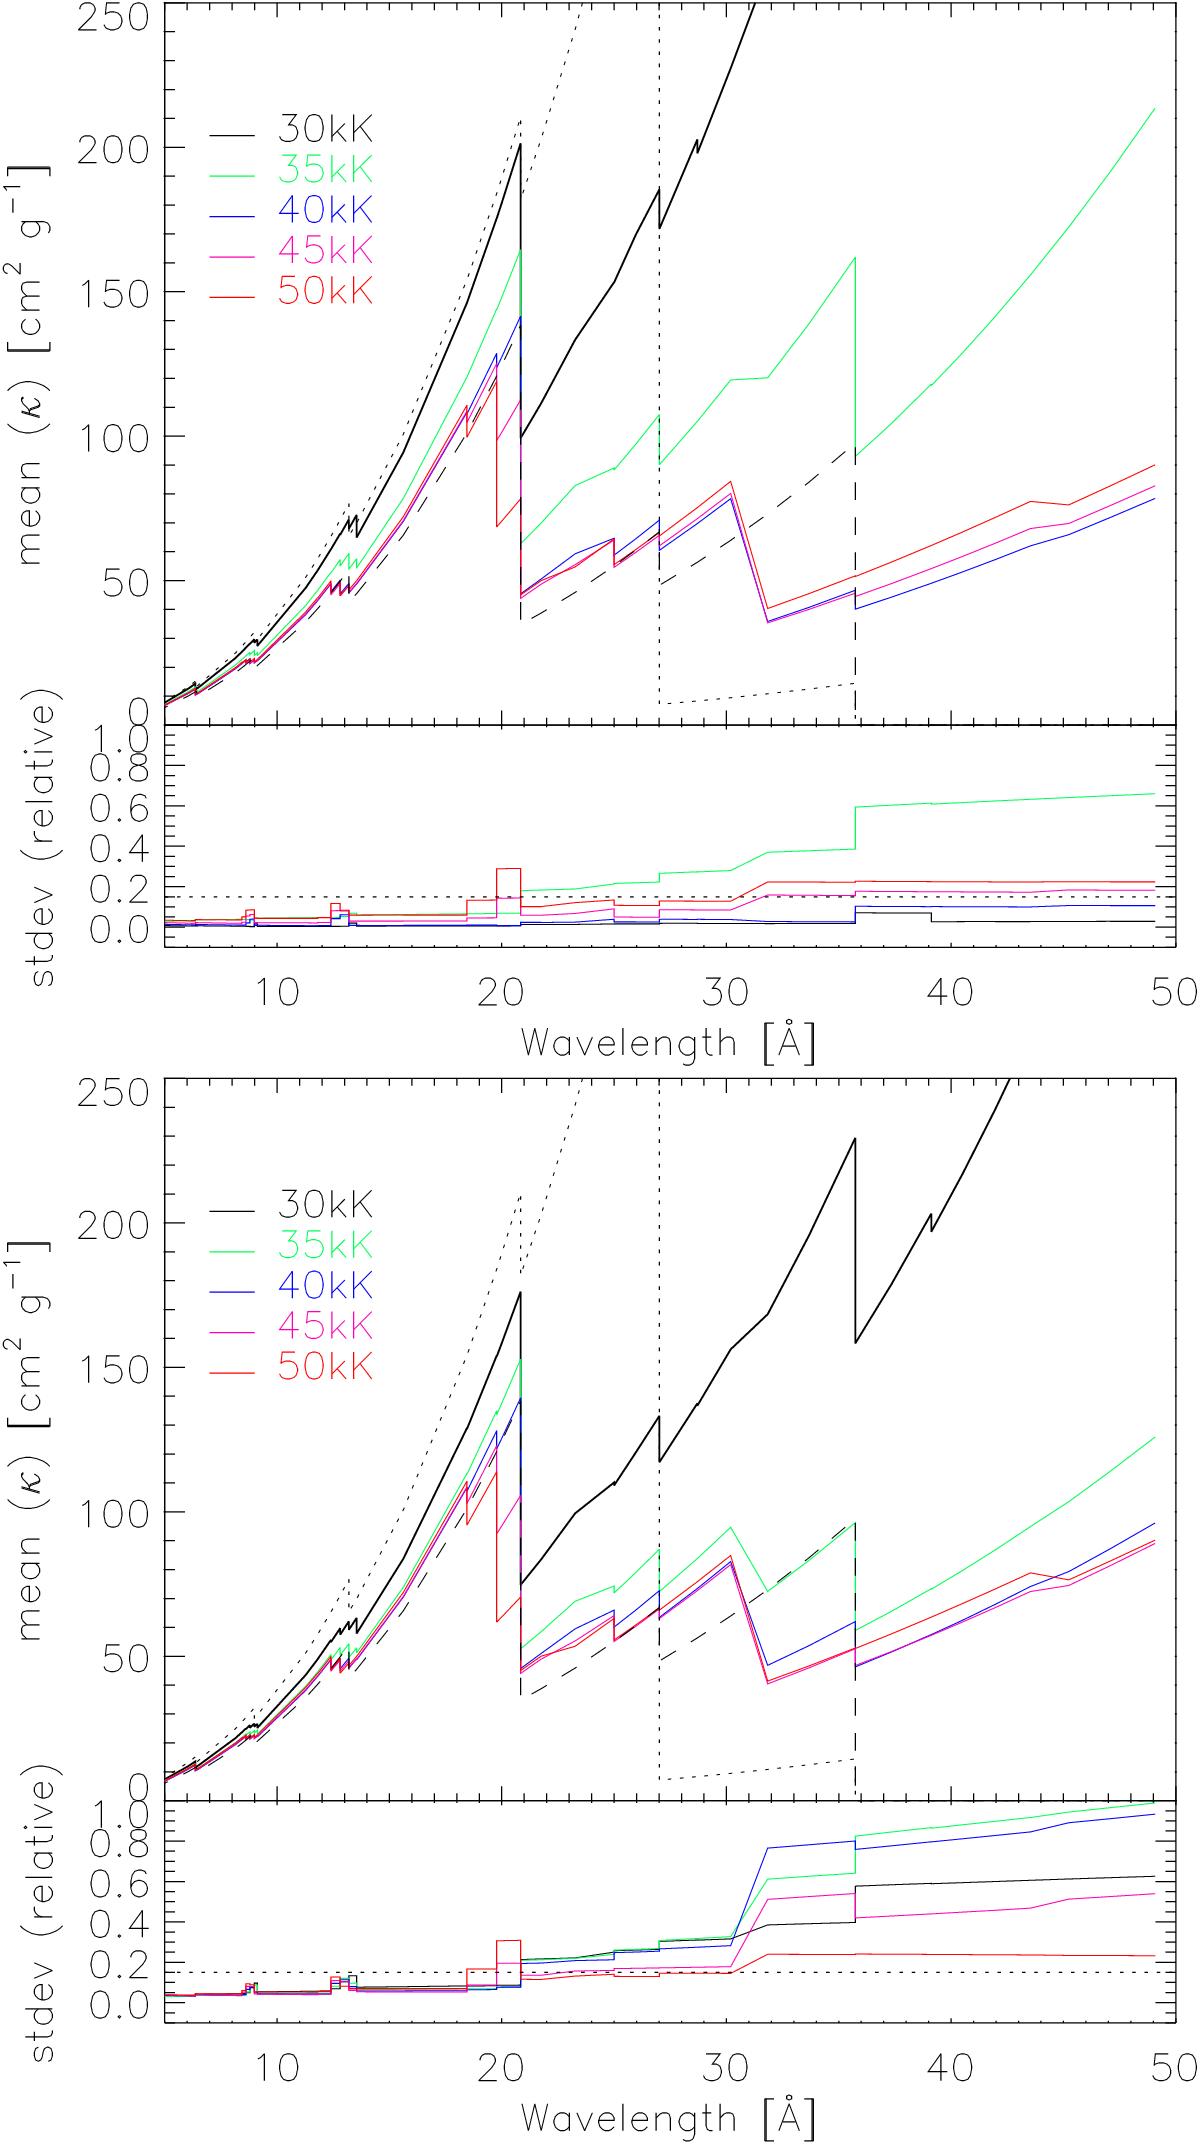
Upper panel, top: density-weighted mean (Eq. (11)) of the mass absorption coefficient, ![]() , for the interval between 1.2 and 110 R∗, as a function of wavelengths and for dwarf models with
, for the interval between 1.2 and 110 R∗, as a function of wavelengths and for dwarf models with ![]() = 3 × 10⁶ K and fX = 0.03. Solar abundances following Asplund et al. (2009) were adopted. Dashed: approximate, radius-independent
= 3 × 10⁶ K and fX = 0.03. Solar abundances following Asplund et al. (2009) were adopted. Dashed: approximate, radius-independent ![]() (Eq. (9)), using only solar abundances and K-shell opacities with cross sections from C iv (with threshold at 35.7 Å), N iv (27.0 Å), O iv (20.8 Å), Ne iv (13.2 Å), Mg iv (9.0 Å), and Si iv (6.4 Å). The C v edge (at 31.6 Å) appears to be unresolved in our frequency grid. Dotted: same as dashed, but with nuclear processed CNO abundances as derived for ζ Pup by Bouret et al. (2012). The nitrogen abundance is more than a factor of 10 larger than the solar abundance. Dashed and dotted lines also serve as a guideline for comparison with similar figures. Bottom: relative standard deviation,
(Eq. (9)), using only solar abundances and K-shell opacities with cross sections from C iv (with threshold at 35.7 Å), N iv (27.0 Å), O iv (20.8 Å), Ne iv (13.2 Å), Mg iv (9.0 Å), and Si iv (6.4 Å). The C v edge (at 31.6 Å) appears to be unresolved in our frequency grid. Dotted: same as dashed, but with nuclear processed CNO abundances as derived for ζ Pup by Bouret et al. (2012). The nitrogen abundance is more than a factor of 10 larger than the solar abundance. Dashed and dotted lines also serve as a guideline for comparison with similar figures. Bottom: relative standard deviation, ![]() (see Eq. (12)), for the same models. The dotted line denotes a relative scatter of 15%. Lower panel: as above, but for supergiant models.
(see Eq. (12)), for the same models. The dotted line denotes a relative scatter of 15%. Lower panel: as above, but for supergiant models.
Current usage metrics show cumulative count of Article Views (full-text article views including HTML views, PDF and ePub downloads, according to the available data) and Abstracts Views on Vision4Press platform.
Data correspond to usage on the plateform after 2015. The current usage metrics is available 48-96 hours after online publication and is updated daily on week days.
Initial download of the metrics may take a while.