Fig. 15
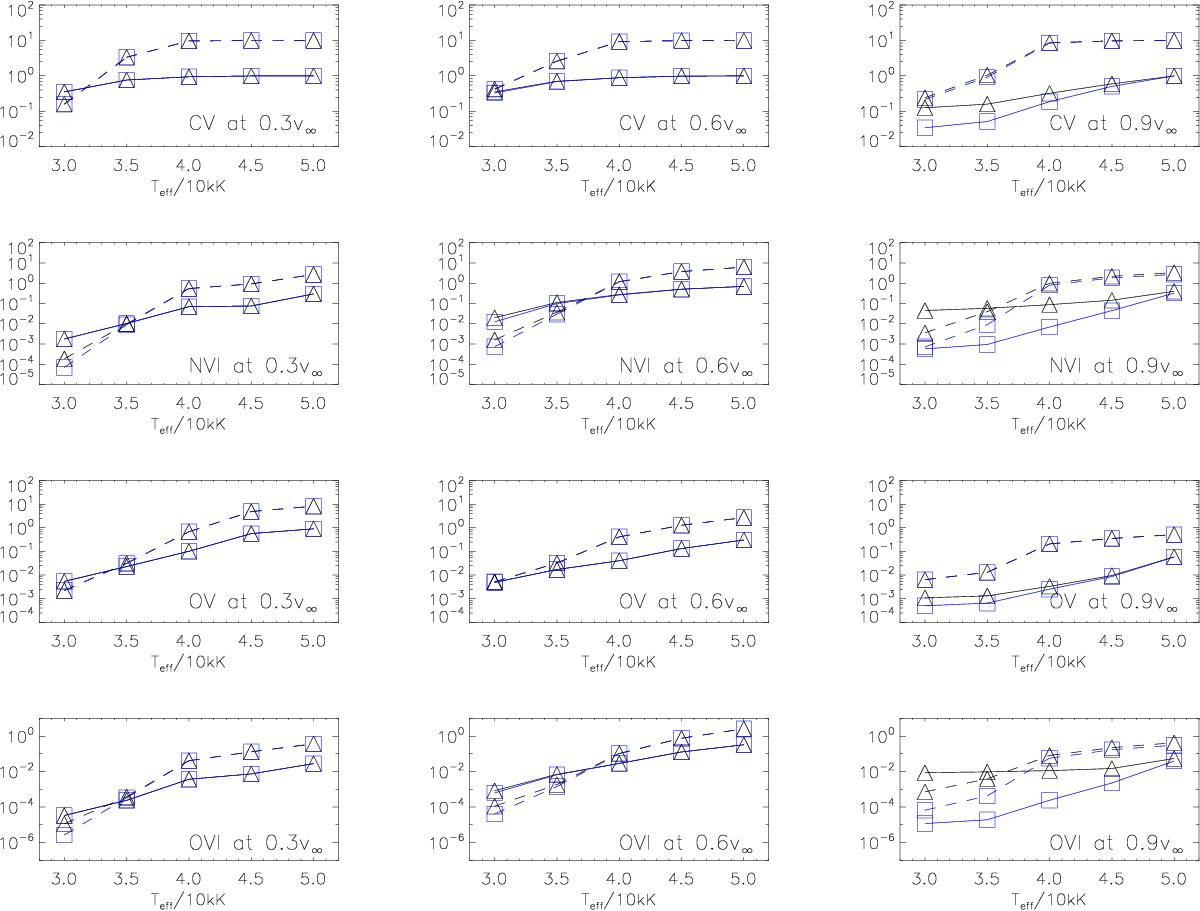
Ionization fractions of ions most affected by Auger ionization, at different depth points. All models have typical X-ray emission parameters (fX = 0.03 and ![]() = 3 × 10⁶ K). The triangles represent models including Auger ionization (standard approach, similar to Fig. 8), and squares models without (i.e., only direct ionization has been considered). Solid lines refer to supergiant models, and dashed ones to dwarf models. For clarity, the ionization fractions of dwarf models have been shifted by one dex.
= 3 × 10⁶ K). The triangles represent models including Auger ionization (standard approach, similar to Fig. 8), and squares models without (i.e., only direct ionization has been considered). Solid lines refer to supergiant models, and dashed ones to dwarf models. For clarity, the ionization fractions of dwarf models have been shifted by one dex.
Current usage metrics show cumulative count of Article Views (full-text article views including HTML views, PDF and ePub downloads, according to the available data) and Abstracts Views on Vision4Press platform.
Data correspond to usage on the plateform after 2015. The current usage metrics is available 48-96 hours after online publication and is updated daily on week days.
Initial download of the metrics may take a while.