Fig. 5
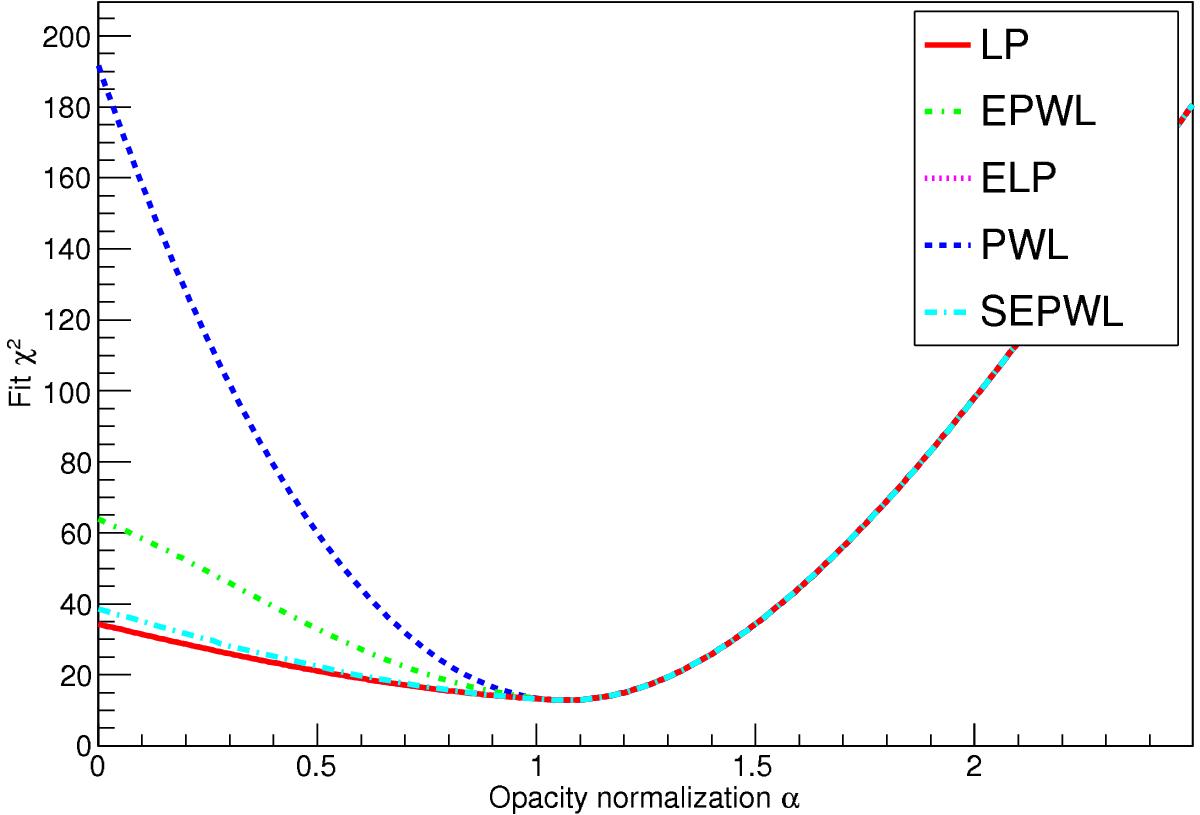
Fit χ2 distributions for the average spectrum of the February–March flare of 1ES 1011+496 for the five models tested. PWL in blue (dashed line), LP in red (solid line), EPWL in green (dot-dash line) and ELP in pink (dotted line) and SEPWL in light blue (long dash-dot line). The LP red line is overlapping ELP pink line. Notice how all curves converge after reaching the minimum.
Current usage metrics show cumulative count of Article Views (full-text article views including HTML views, PDF and ePub downloads, according to the available data) and Abstracts Views on Vision4Press platform.
Data correspond to usage on the plateform after 2015. The current usage metrics is available 48-96 hours after online publication and is updated daily on week days.
Initial download of the metrics may take a while.