Free Access
Fig. 1
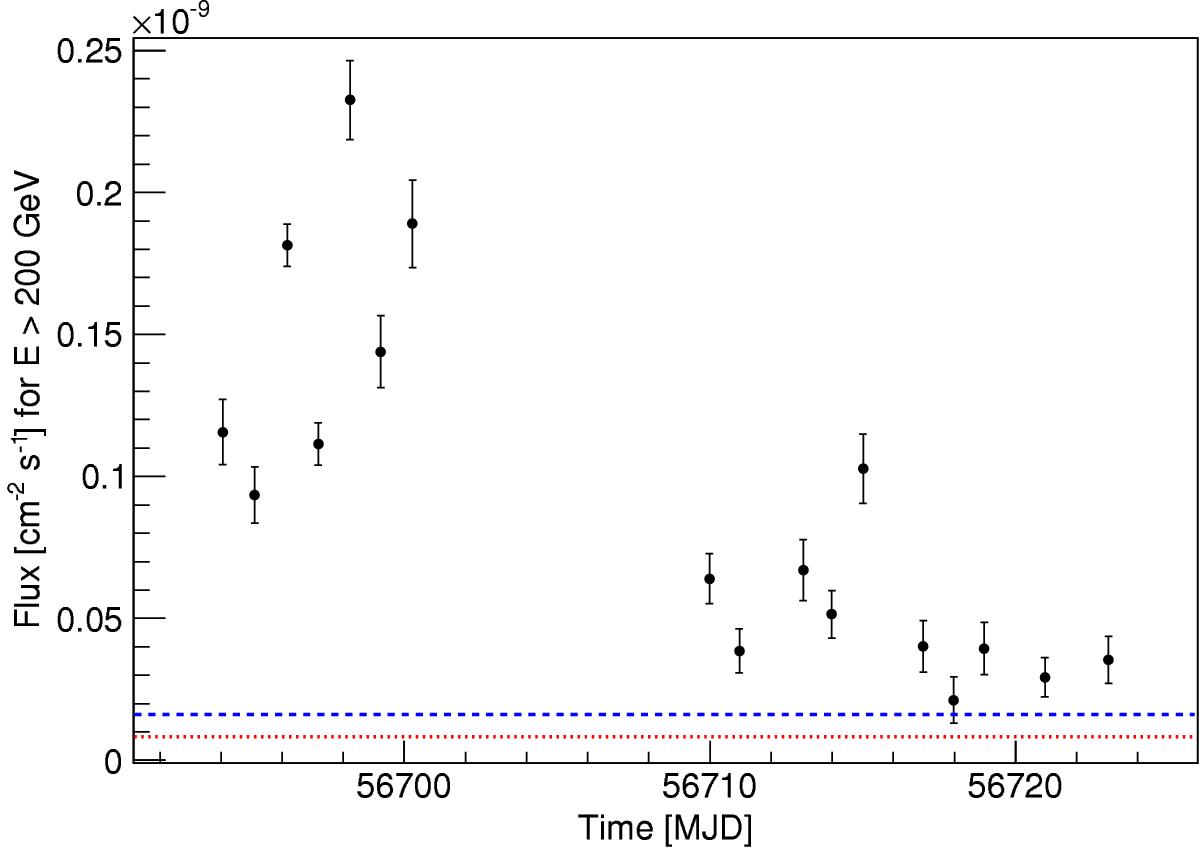
1ES 1011+496 light curve between February 6th and March 7th 2014 above an energy threshold of 200 GeV with a night-wise binning. The blue dashed line indicates the mean integral flux for the MAGIC observations of 2007 and the red dotted line the MWL campaign between 2011 and 2012.
Current usage metrics show cumulative count of Article Views (full-text article views including HTML views, PDF and ePub downloads, according to the available data) and Abstracts Views on Vision4Press platform.
Data correspond to usage on the plateform after 2015. The current usage metrics is available 48-96 hours after online publication and is updated daily on week days.
Initial download of the metrics may take a while.