Fig. 6
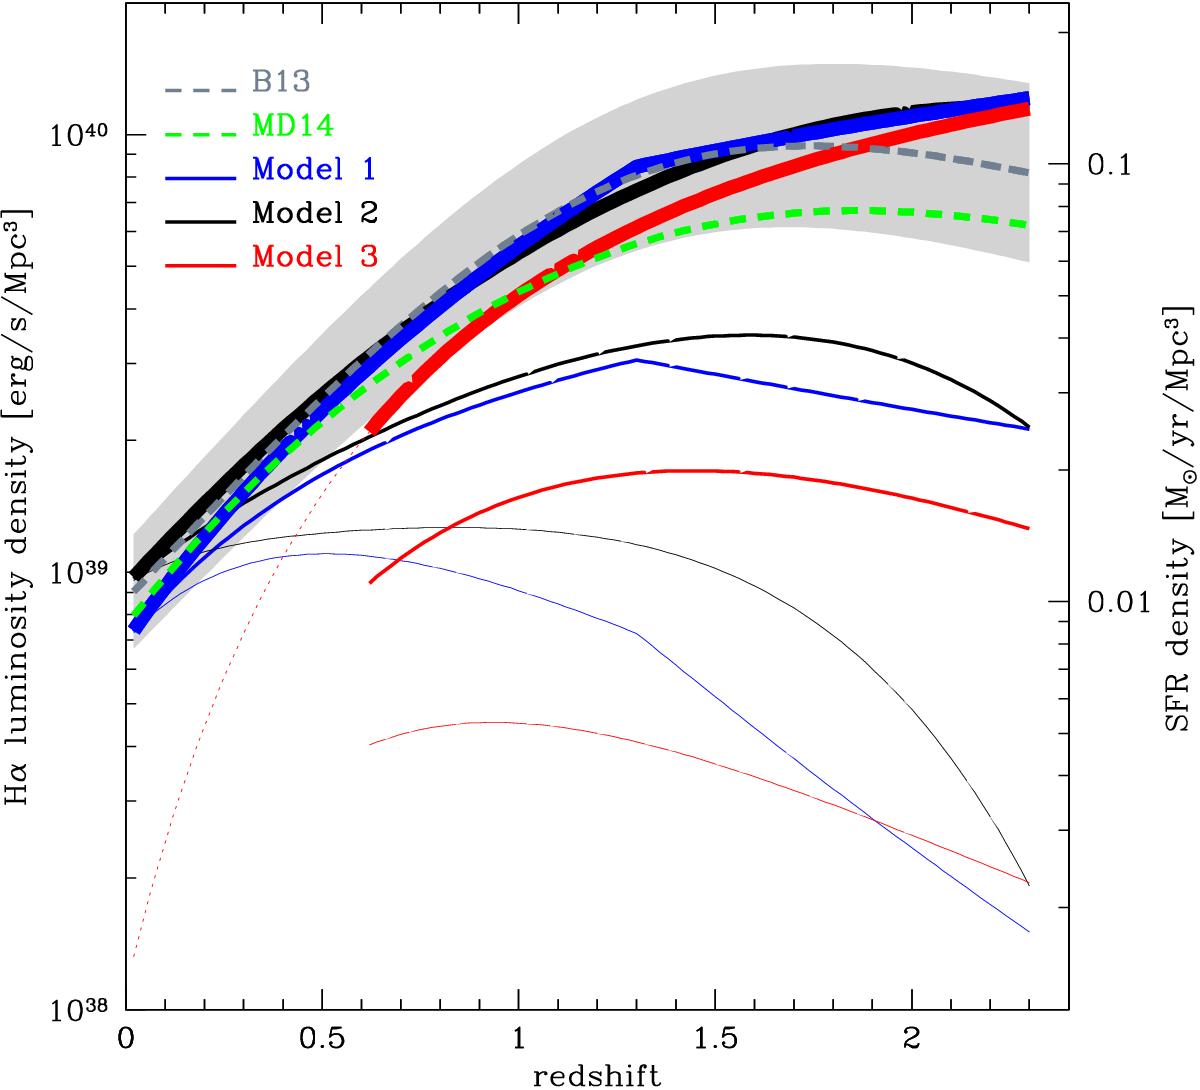
Hα luminosity density of the Universe as a function of redshift. The solid thick lines show the total luminosity density, whereas the thin solid curves show the luminosity density for emitters at F> 10-16 erg cm-2 s-1 (upper set of curves) and F> 3 × 10-16 erg cm-2 s-1 (lower set of curves). The different colours are codes for each model (blue, Model 1; black, Model 2; and red, Model 3). Also shown is the calculation of total Hα luminosity density based on the star formation histories of Madau & Dickinson (2014, green dashed) and Behroozi et al. (2013, gray dashed and shaded area). On the right axis we report also the SFR density scale for a Chabrier IMF.
Current usage metrics show cumulative count of Article Views (full-text article views including HTML views, PDF and ePub downloads, according to the available data) and Abstracts Views on Vision4Press platform.
Data correspond to usage on the plateform after 2015. The current usage metrics is available 48-96 hours after online publication and is updated daily on week days.
Initial download of the metrics may take a while.