Fig. 4
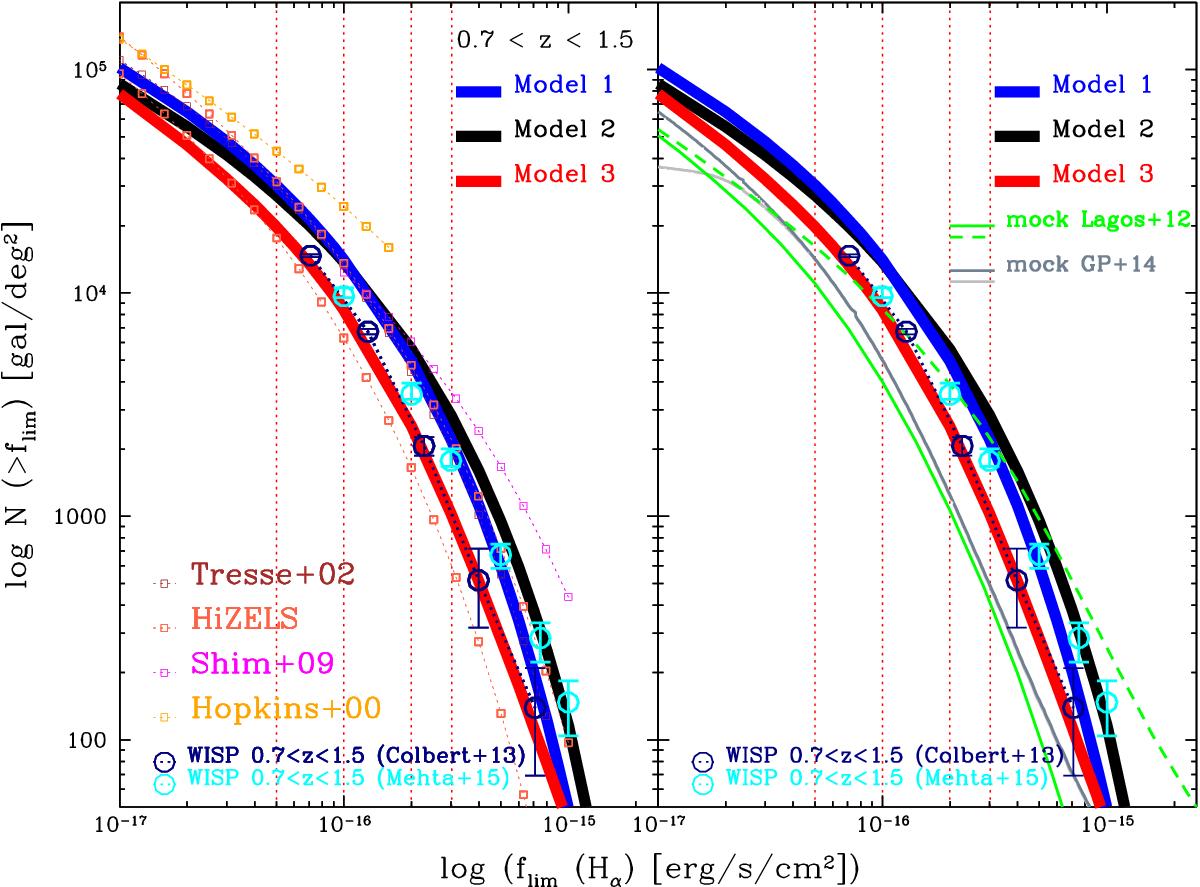
Left panel: cumulative Hα number counts, integrated over the redshift ranges 0.7 <z< 1.5 (WISP range). The observed counts from the WISP survey (Colbert et al. 2013) are shown (blue circles) and from new WISP analysis by Mehta et al. (2015; cyan circles), and compared to the empirical Model 1, 2, and 3, (blue, black and red lines, respectively). Also shown (as dotted lines and empty squares) are the counts obtained integrating the observed LFs (see legend) in the same redshift range. Right panel: same cumulative Hα number counts compared to the predictions from L12 mocks (green dashed and solid lines using intrinsic and extincted Hα fluxes, respectively) and GP14 mocks (dark and light grey for H< 27 and H< 24 mocks, respectively).
Current usage metrics show cumulative count of Article Views (full-text article views including HTML views, PDF and ePub downloads, according to the available data) and Abstracts Views on Vision4Press platform.
Data correspond to usage on the plateform after 2015. The current usage metrics is available 48-96 hours after online publication and is updated daily on week days.
Initial download of the metrics may take a while.