Fig. 3
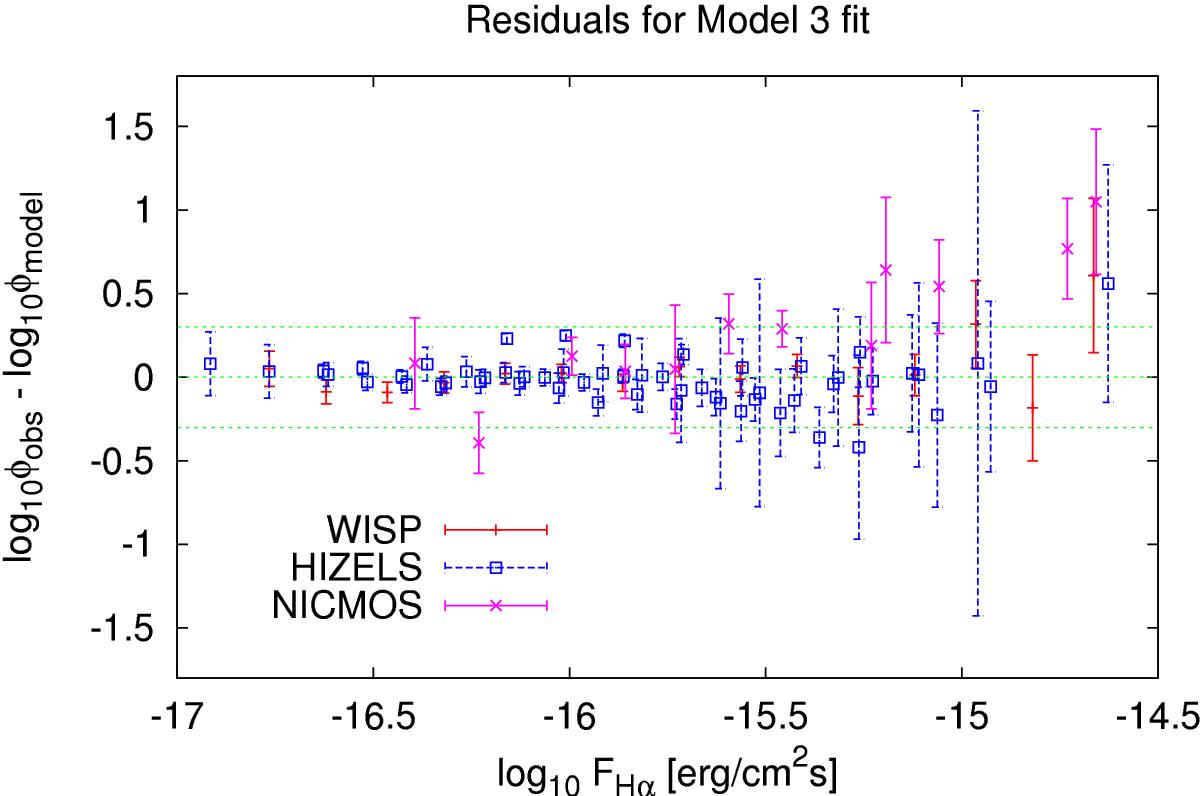
Residuals to the Hα luminosity function fits for Model 3, plotted as a function of observed-frame Hα flux at the bin centre (horizontal axis). All redshifts are plotted together. The green lines show the fit line and factors of 2 above and below. The error bars shown do not include the cosmic variance, which is included in the fit but is highly correlated across luminosity bins.
Current usage metrics show cumulative count of Article Views (full-text article views including HTML views, PDF and ePub downloads, according to the available data) and Abstracts Views on Vision4Press platform.
Data correspond to usage on the plateform after 2015. The current usage metrics is available 48-96 hours after online publication and is updated daily on week days.
Initial download of the metrics may take a while.