Fig. 1
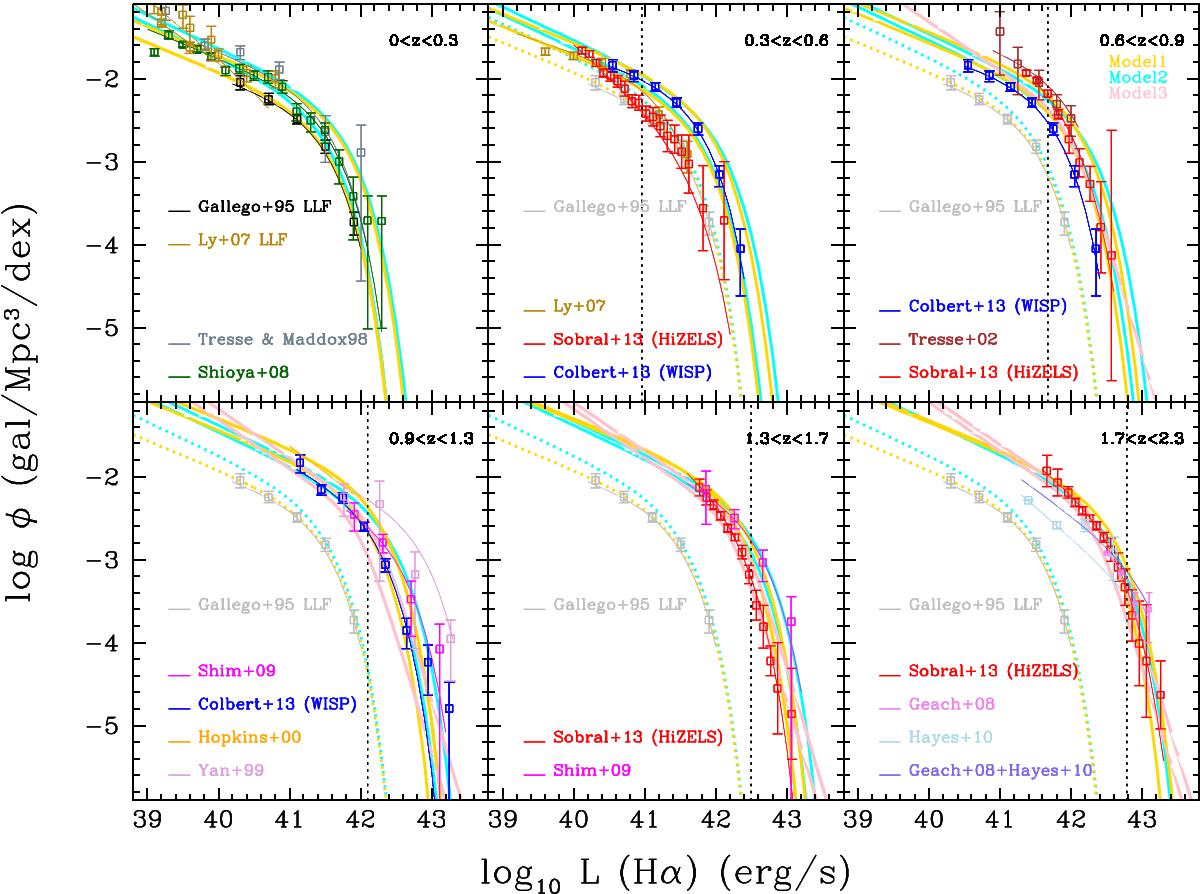
Hα LFs at various redshifts. The dotted lines mark the nominal flux limit of Euclid (3 × 10-16 erg cm-2 s-1) in the lower bound of each redshift range. Observed Schechter LFs are shown as thin lines and squares in the observed luminosity range and listed in the labels. For comparison, the LFs from Empirical Models 1, 2, and 3 are shown (in yellow, cyan, and pink, respectively) as thick lines in the same redshift range (shown in the two extremes of each redshift bin).
Current usage metrics show cumulative count of Article Views (full-text article views including HTML views, PDF and ePub downloads, according to the available data) and Abstracts Views on Vision4Press platform.
Data correspond to usage on the plateform after 2015. The current usage metrics is available 48-96 hours after online publication and is updated daily on week days.
Initial download of the metrics may take a while.