Fig. 9
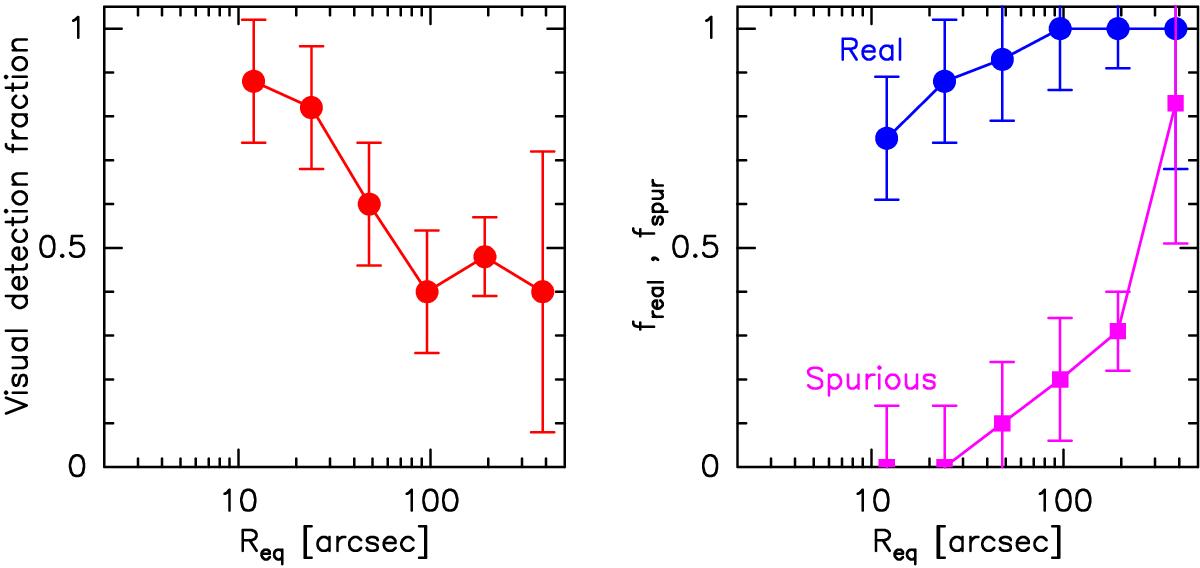
Left: fraction of real SDCs as estimated through visual inspection (red symbols and solid line). Right: fraction of visually confirmed real SDCs that have been identified as real SDCs by our automated detection scheme (freal – blue round symbols), and fraction of visually confirmed spurious SDCs that have been misclassified as real SDCs by our automated detection scheme (fspur – purple square symbols). These two curves can directly be compared to our detection simulation results presented in Fig. 8. All error bars correspond to Poisson noise.
Current usage metrics show cumulative count of Article Views (full-text article views including HTML views, PDF and ePub downloads, according to the available data) and Abstracts Views on Vision4Press platform.
Data correspond to usage on the plateform after 2015. The current usage metrics is available 48-96 hours after online publication and is updated daily on week days.
Initial download of the metrics may take a while.