Free Access
Fig. 7
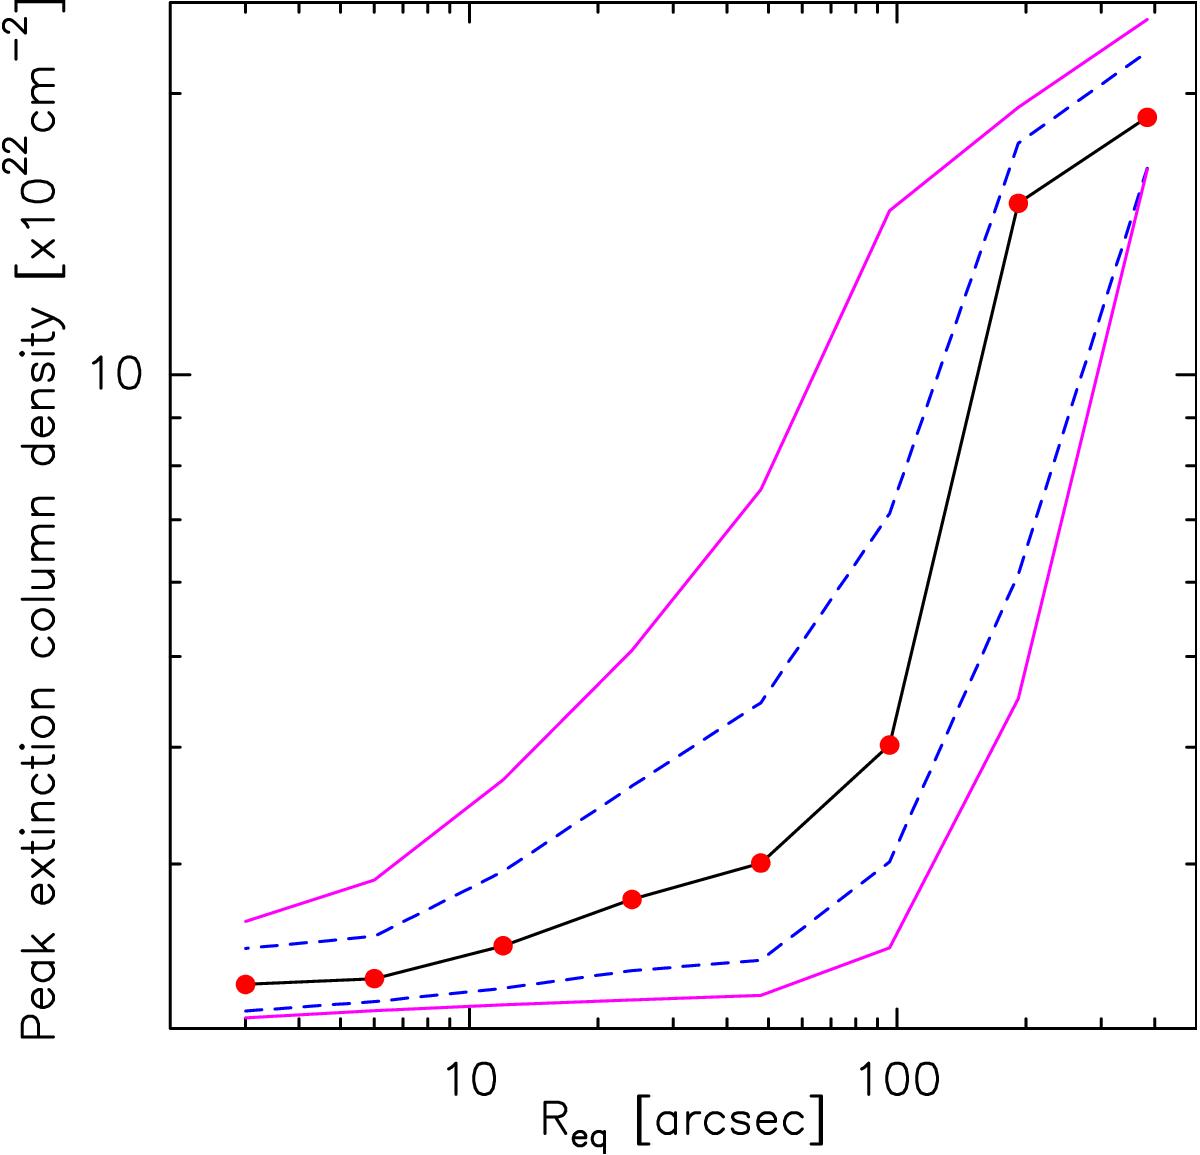
Angular radius binned the same way as in Fig. 6 versus the median (red symbols and black solid line) peak extinction column densities of all SDCs from the PF09 catalogue. The purple solid lines and blue dashed lines are the 10/90 percentiles and 25/75 percentiles, respectively.
Current usage metrics show cumulative count of Article Views (full-text article views including HTML views, PDF and ePub downloads, according to the available data) and Abstracts Views on Vision4Press platform.
Data correspond to usage on the plateform after 2015. The current usage metrics is available 48-96 hours after online publication and is updated daily on week days.
Initial download of the metrics may take a while.