Free Access
Fig. 4
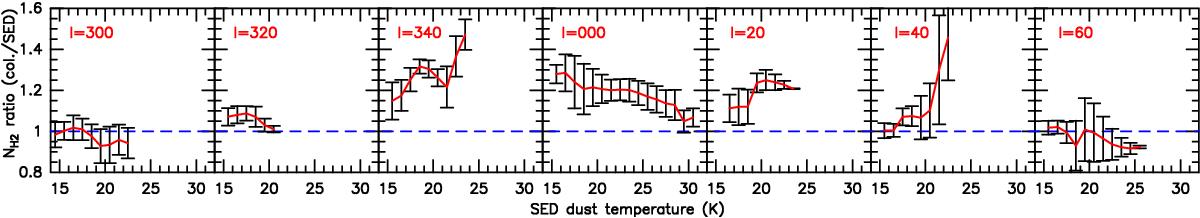
Ratio of the colour-based over SED column densities as a function of SED dust temperature for entire Hi-GAL tiles. The red solid line shows the average ratio over the corresponding tile, while the error bars represent one σ deviations. The blue dashed line indicates a ratio of 1.
Current usage metrics show cumulative count of Article Views (full-text article views including HTML views, PDF and ePub downloads, according to the available data) and Abstracts Views on Vision4Press platform.
Data correspond to usage on the plateform after 2015. The current usage metrics is available 48-96 hours after online publication and is updated daily on week days.
Initial download of the metrics may take a while.