Fig. A.1
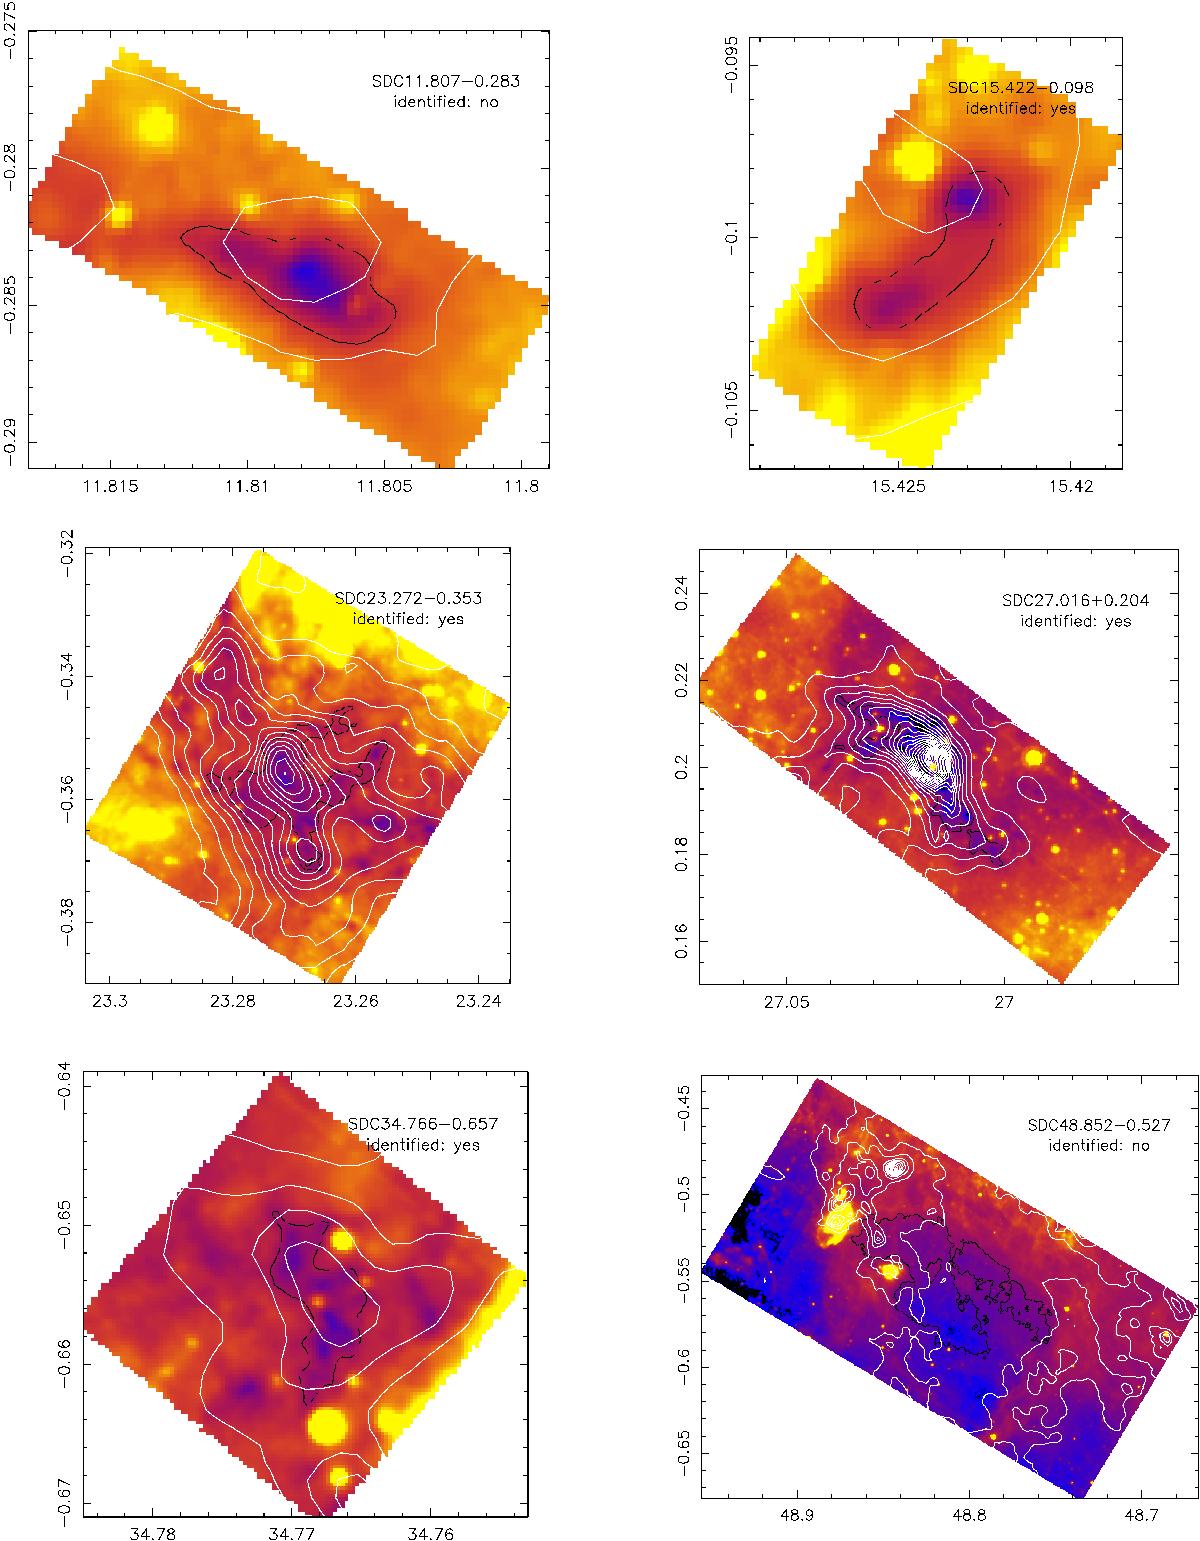
Images of 6 randomly selected SDCs. The colour scale is the Spitzer 8 μm emission. The black contour is the τ8 μm = 0.35 contour marking the boundary of the SDC as originally identified in PF09. The white contours are the Herschel H2 column density contours, all starting at 0.1 × 1022 cm-2, and separated by 0.5 × 1022 cm-2. The axes of the images are galactic coordinates in degrees. In the top right corner we give the name of the SDC and if our identification scheme has recognised them as being identified with a Herschel column density peak. SDC11.807-0.283 is not identified while, by eye, it seems clearly associated with a faint peak. Criterion c2 for this cloud is slightly below our threshold value of 3, explaining why it is not picked up by our identification scheme.
Current usage metrics show cumulative count of Article Views (full-text article views including HTML views, PDF and ePub downloads, according to the available data) and Abstracts Views on Vision4Press platform.
Data correspond to usage on the plateform after 2015. The current usage metrics is available 48-96 hours after online publication and is updated daily on week days.
Initial download of the metrics may take a while.