Fig. 9
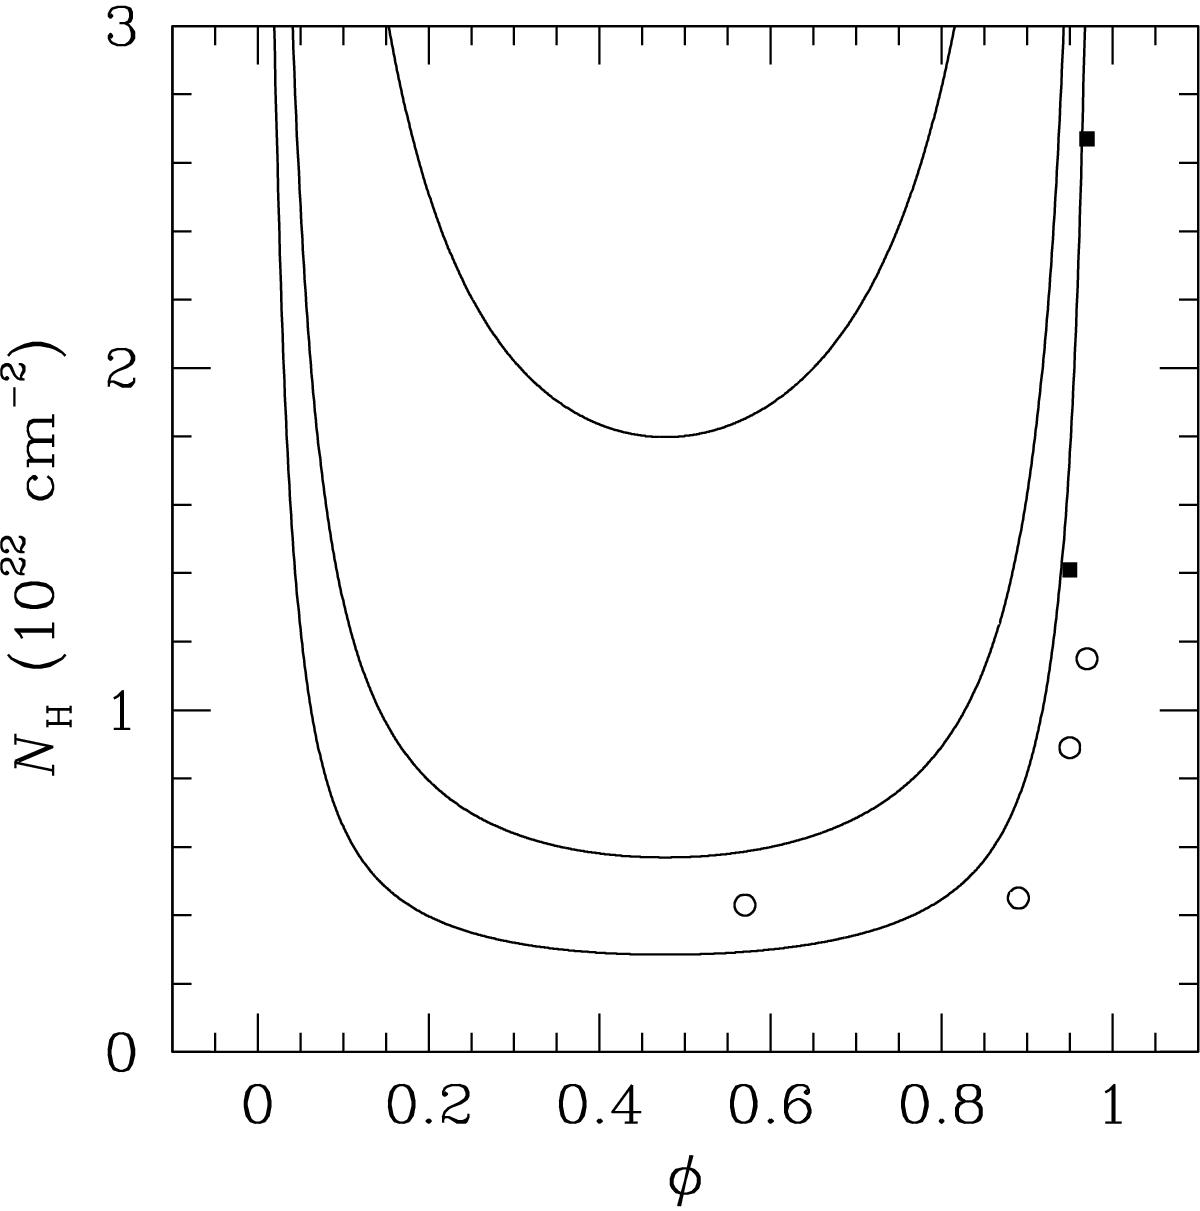
Variation with phase of the equivalent hydrogen column density along the line of sight from the apex. The column is computed according to the physical parameters given in Table 2 and for an inclination of 58.̊8. We show the curves expected for various mass-loss rates: 0.5 × 10⁻⁵ M⊙ yr-1 (lower curve), 1.0 × 10⁻⁵ M⊙ yr-1 (middle curve), and 3.2 × 10⁻⁵ M⊙ yr-1 (upper curve, value adopted in Table 2). The figure also includes (open circles) the four values for the common column fits deduced from the XMM-Newton observations. In addition, the two filled squares indicate the column in front of the sole hard component for the XMM-3 and XMM-4 pointings.
Current usage metrics show cumulative count of Article Views (full-text article views including HTML views, PDF and ePub downloads, according to the available data) and Abstracts Views on Vision4Press platform.
Data correspond to usage on the plateform after 2015. The current usage metrics is available 48-96 hours after online publication and is updated daily on week days.
Initial download of the metrics may take a while.