Fig. 8
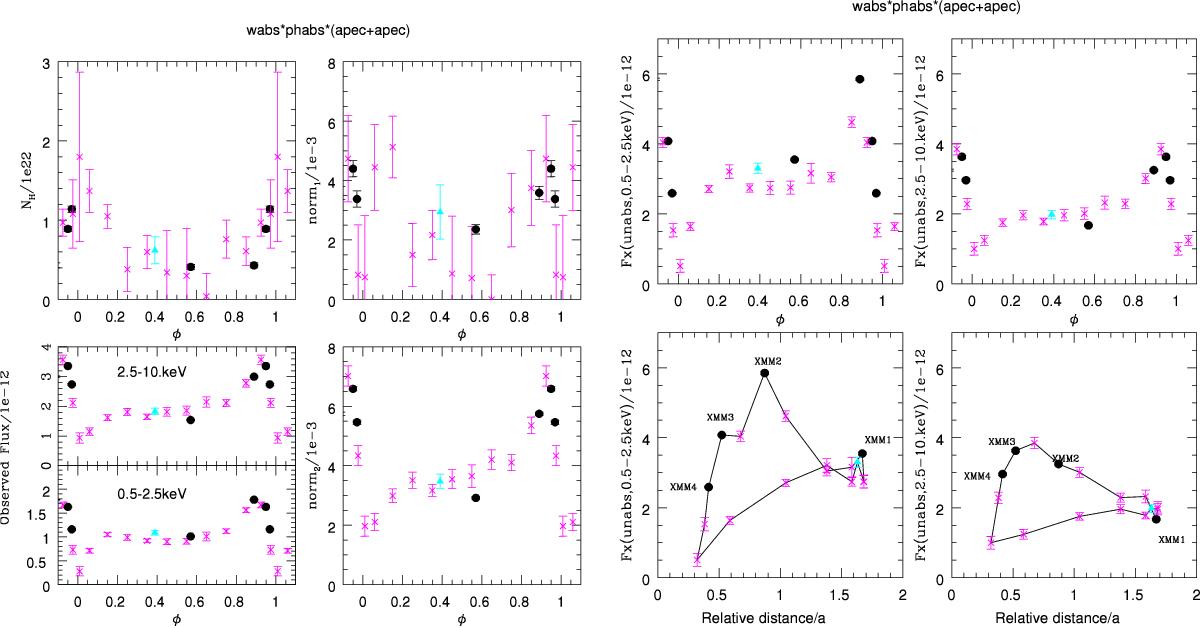
Variation with orbital phase of the spectral fit parameters and fluxes (see Table 6 for details). Black dots correspond to XMM-Newton spectra, the cyan filled triangle to the Chandra spectrum, and magenta crosses to binned Swift spectra (see text). Left panel: absorption, normalisation factors, and observed fluxes. Right panel: ISM-absorption corrected fluxes, in both the 0.5–2.5 keV and 2.5–10.0 keV energy bands, as a function of phase (top) and separation (bottom).
Current usage metrics show cumulative count of Article Views (full-text article views including HTML views, PDF and ePub downloads, according to the available data) and Abstracts Views on Vision4Press platform.
Data correspond to usage on the plateform after 2015. The current usage metrics is available 48-96 hours after online publication and is updated daily on week days.
Initial download of the metrics may take a while.