Fig. 4
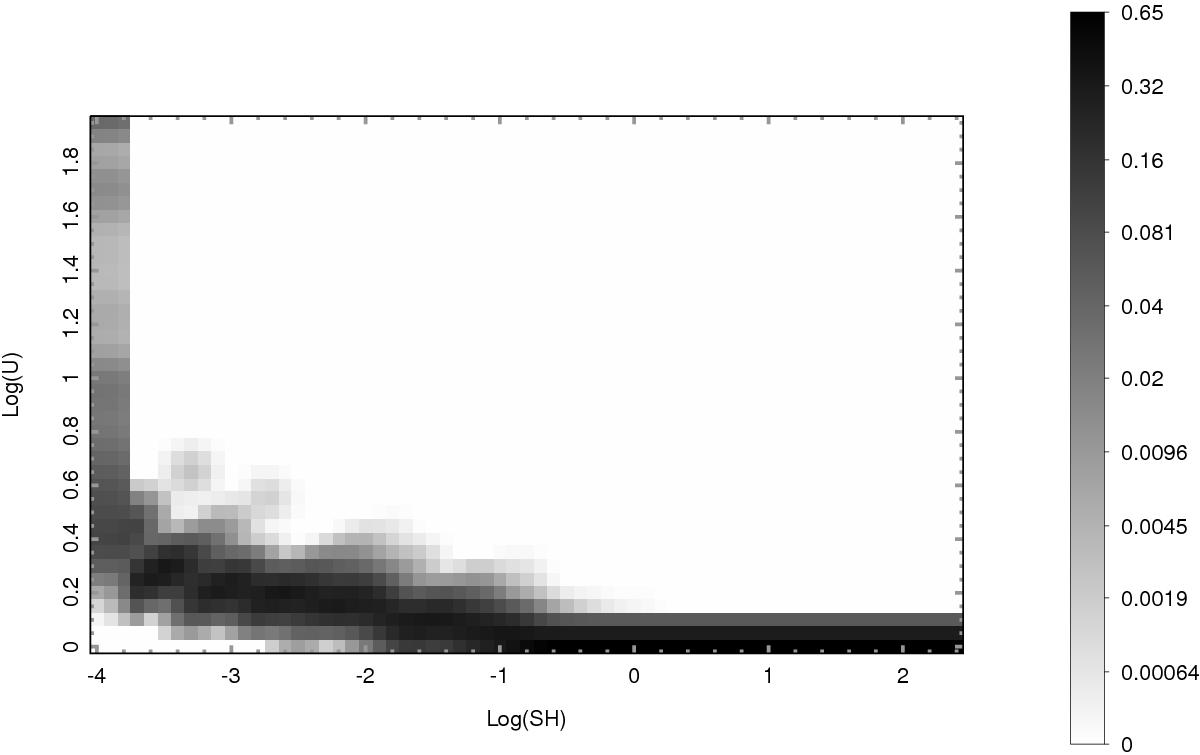
Probability distribution of the unabsorbed/absorbed flux ratio in the 2–10 keV, as a function of the measured 0.5–2/2–10 keV flux ratio, for the Burlon sample, at redshift zero. The x-axis shows Log(SH), therefore hard sources are on the left and soft sources are on the right. The y-axis shows Log(U), therefore no correction is at the bottom and large corrections are at the top. The colour scale goes from white (low probability) to black (high probability).
Current usage metrics show cumulative count of Article Views (full-text article views including HTML views, PDF and ePub downloads, according to the available data) and Abstracts Views on Vision4Press platform.
Data correspond to usage on the plateform after 2015. The current usage metrics is available 48-96 hours after online publication and is updated daily on week days.
Initial download of the metrics may take a while.