| Issue |
A&A
Volume 590, June 2016
|
|
|---|---|---|
| Article Number | A40 | |
| Number of page(s) | 12 | |
| Section | Extragalactic astronomy | |
| DOI | https://doi.org/10.1051/0004-6361/201424773 | |
| Published online | 04 May 2016 | |
Radio and gamma-ray properties of extragalactic jets from the TANAMI sample
1 Max-Planck-Institut für
Radioastronomie, Auf dem Hügel
69, 53121 Bonn, Germany
e-mail: boeck.moritz@gmail.com
2 Dr. Karl-Remeis-Sternwarte,
Astronomisches Institut der Universität Erlangen-Nürnberg,
and Erlangen Centre for
Astroparticle Physics, Sternwartstraße 7, 96049
Bamberg,
Germany
3 Lehrstuhl für Astronomie, Universität
Würzburg, Emil-Fischer Str.
31, 97074
Würzburg,
Germany
e-mail: matthias.kadler@astro.uni-wuerzburg.de
4 Department of Astrophysics, Institute
for Mathematics, Astrophysics and Particle Physics, Radboud University
Nijmegen, PO Box
9010, 6500 GL
Nijmegen, The
Netherlands
5 INFN/University of Perugia,
06123
Perugia,
Italy
6 NASA Goddard Space Flight Center,
Astrophysics Science Division, Code
661, Greenbelt,
MD
20771,
USA
e-mail: roopesh.ojha@nasa.gov
7 Institute for Astrophysics &
Computational Sciences, Catholic University of America, Washington, DC
20064,
USA
8 CRESST/University of Maryland,
Baltimore County, 1000 Hilltop
Circle, Baltimore,
MD
21250,
USA
9 Istituto Nazionale di Fisica
Nucleare, Sezione di Padova, 35131
Padova,
Italy
10 Dipartimento di Fisica e Astronomia
“G. Galilei”, Università di Padova, 35131
Padova,
Italy
11 University of Washington,
Seattle,
WA
98195,
USA
12 Agenzia Spaziale Italiana (ASI)
Science Data Center, 00133
Roma,
Italy
13 School of Mathematics &
Physics, University of Tasmania, Private Bag 37, Hobart, 7001
Tasmania,
Australia
14 CSIRO Astronomy and Space Science,
ATNF, PO Box 76 Epping, NSW
1710,
Australia
15 Bundesamt für Kartographie und
Geodäsie, 93444
Bad Kötzting,
Germany
16 CSIRO Astronomy and Space Science,
Canberra Deep Space Communications Complex, PO Box 1035, Tuggeranong, ACT
2901,
Australia
17 Hartebeesthoek Radio Astronomy
Observatory, 1740
Krugersdorp, South
Africa
18 Department of Physics, Purdue
University, 525 Northwestern
Avenue, West
Lafayette, IN
47907,
USA
19 Centre d’Études Nucléaires de
Bordeaux Gradignan, IN2P3/CNRS, Université Bordeaux 1, BP120, 33175
Gradignan Cedex,
France
20 Jet Propulsion Laboratory,
4800 Oak Grove
Drive, Pasadena,
CA
91109,
USA
21 Nordic Optical Telescope, Apartado
474, 38700 Santa Cruz de La Palma, Santa Cruz de Tenerife, Spain
22 Observatori Astronòmic, Universitat
de València, Parc Científic, C.
Catedrático José Beltrán 2, 46980 Paterna, València,
Spain
23 Departament d’Astronomia i
Astrofísica, Universitat de València, C. Dr. Moliner 50, 46100 Burjassot,
València,
Spain
24 Department of Physics and
Astronomy, University of New Mexico, Albuquerque
NM, 87131,
USA
25 Adjunct Astronomer at the National Radio Astronomy
Observatory, USA
26 Centre for Astrophysics and
Supercomputing, Swinburne University of Technology, PO Box 218, Hawthorn, VIC
3122,
Australia
Received:
7
August
2014
Accepted:
2
November
2015
The TANAMI program has been observing parsec-scale radio jets of southern (declination south of − 30°) γ-ray bright AGN, simultaneously with Fermi/LAT monitoring of their γ-ray emission, via high-resolution radio imaging with Very Long Baseline Interferometry techniques. We present the radio and γ-rayproperties of the TANAMI sources based on one year of contemporaneous TANAMI and Fermi/LAT data. A large fraction (72%) of the TANAMI sample can be associated with bright γ-ray sources for this time range. Association rates differ for different optical classes with all BL Lacs, 76% of quasars, and just 17% of galaxies detected by the LAT. Upper limits were established on the γ-ray flux from TANAMI sources not detected by LAT. This analysis led to the identification of three new Fermi sources whose detection was later confirmed. The γ-ray and radio luminosities are related by Lγ ∝ Lr0.89±0.04. The brightness temperatures of the radio cores increase with the average γ-ray luminosity and the presence of brightness temperatures above the inverse Compton limit implies strong Doppler boosting in those sources. The undetected sources have lower γ/radio luminosity ratios and lower contemporaneous brightness temperatures. Unless the Fermi/LAT-undetected blazars are much γ-ray-fainter than the Fermi/LAT-detected sources, their γ-ray luminosity should not be significantly lower than the upper limits calculated here.
Key words: galaxies: active / galaxies: nuclei / galaxies: jets / gamma rays: galaxies / radio continuum: galaxies
© ESO, 2016
1. Introduction
Blazars are a subset of active galactic nuclei (AGN). They are very luminous, highly variable, and show strong polarized emission (Urry & Padovani 1995). These properties can be explained by emission from collimated jets consisting of charged particles moving at relativistic velocities that are oriented at a small angle to the line of sight and thus Doppler boosted (Blandford & Rees 1978; Maraschi et al. 1992). This explanation is confirmed by the fact that blazars typically exhibit apparent superluminal motion in the inner radio jet (see, e.g., Lister et al. 2013, for an extensive study). While detailed understanding of their emission processes is still a work in progress (e.g., Ghisellini et al. 2009, 2010; Tavecchio et al. 2010, and references therein) a close link between radio and high-energy emission from blazars is clear (Fossati et al. 1998; Kovalev et al. 2009; Ackermann et al. 2011a).
Detailed studies of AGN in the MeV-to-GeV energy regime, with the EGRET detector aboard the Compton Gamma Ray Observatory (CGRO; Thompson et al. 1993), found that many blazars are strong γ-ray emitters (Hartman et al. 1992; Mattox et al. 1996; Bloom 2008, and references therein). Radio observations, particularly using Very Long Baseline Interferometry (VLBI), were immediately recognized as a particularly useful tool to understand high-energy emission from blazars. The VLBI provides information at the highest possible resolution and is the only way to measure kinematics of a blazar jet, including many of the parameters that are essential inputs to models that seek to explain blazar emission processes (e.g., Cohen et al. 2007). Early studies using EGRET and VLBI gave astronomers the first good glimpse of high-energy blazar emission and its connection to radio properties; e.g., compared to nondetections, EGRET detections had a higher radio flux density and variability (Impey 1996; Tingay et al. 2003), higher brightness temperatures (Moellenbrock et al. 1996), more strongly polarized jets (Lister & Homan 2005), and larger than average opening angles (Taylor et al. 2007).
Despite the insights provided into high-energy blazar emission, EGRET data were limited in many ways, such as by the difficulty of precise determination of source positions, the very nonuniform sky coverage, poor temporal sampling, and limited sensitivity. For that reason, many results were tentative, incomplete, or even inconsistent. Most obviously, many of the most radio luminous and compact blazars were not detected. A greatly enhanced successor to EGRET, the Large Area Telescope (LAT) on board the Fermi Gamma-ray Space Telescope (Atwood et al. 2009), was launched on 2008 June 11 and commenced regular observations two months later. The Fermi/LAT is a pair conversion detector of γ-rays with energies in the range ~20 MeV to >300 GeV. The sensitivity of LAT is more than an order of magnitude higher than that of EGRET. In LAT’s sky-survey mode the entire sky is scanned every three hours, and fairly uniform exposure is obtained within two months. One of LAT’s major scientific goals is to observe the γ-ray activity of AGN: to detect, monitor, and characterize rapidly variable flaring sources. Most of the EGRET detections have been confirmed by Fermi. Detailed discussions of AGN detected with Fermi/LAT are given in The First Catalog of Active Galactic Nuclei Detected by the Fermi Large Area Telescope (1LAC; Abdo et al. 2010d), and its second (2LAC; Ackermann et al. 2011b) and third revisions (3LAC; Ackermann et al. 2015).
The TANAMI (Tracking Active Galactic Nuclei with Austral Milliarcsecond Interferometry; Ojha et al. 2010) program is a VLBI monitoring program targeting AGN jets south of − 30° declination. Observations are made at two radio frequencies (8 and 22 GHz) approximately every two months with the telescopes of the Australian Long Baseline Array (LBA; e.g., Ojha et al. 2004) in combination with telescopes in Australia (NASA’s Tidbinbilla facility), South Africa, Antarctica, Chile, and New Zealand. The array has been further expanded by the inclusion of one of the antennas of the Australian Square Kilometre Array Pathfinder (ASKAP) array, the Warkworth antenna in New Zealand (see, e.g., Tzioumis et al. 2010), and the new AuScope antennas at Yarragadee (Western Australia) and Katherine (Northern Territory; see, e.g., Lovell et al. 2013). The dual frequency nature of the VLBI observations yields spectral index maps of parsec-scale jet features. The multi-epoch monitoring enables the determination of jet parameters such as jet speed and collimation angles via tracking of individual jet components. As these critical parameters cannot be determined by any other observational technique, the highest possible spatial resolution provided by VLBI is uniquely important to understanding high-energy emission processes in jets.
Complementary to correlations between the total unresolved radio and the gamma-ray flux (e.g., Ackermann et al. 2011a), observations by TANAMI and other groups have shown that the γ-ray brightness of AGN, as seen by LAT, is correlated with VLBI jet properties, such as the opening angle or jet speed, and found other connections, e.g, between γ-ray loudness and synchrotron peak frequency (Lister et al. 2009, 2011; Kovalev et al. 2009; Ojha et al. 2010; Linford et al. 2012). We present 8.4 GHz radio and γ-ray properties of the TANAMI sample, as obtained from an analysis of the first eleven months of Fermi/LAT observations, which is the period of time used for the First LAT Catalog (1FGL; Abdo et al. 2010c). The 1FGL data set covers the period from 2008 August 4 to 2009 July 4. Our analysis is based on the 1FGL period because the TANAMI sample has been selected to include southern AGN detected with Fermi/LAT in this period of time (details of the sample selection are provided in Sect. 2.1). We use γ-ray data only covering the same period of time as the radio data. As a result of source variability, the usage of nonsimultaneous data would wash out the signal from these correlation studies between the two energy regimes; Pushkarev et al. (2010) find a radio/γ-ray delay on the order of months for the best correlation. At higher radio frequencies shorter time delays are observed. By studying variability of individual sources, León-Tavares et al. (2011) found that the brightest γ-ray emission (seen with Fermi/LAT) occurs in the rising phase of millimeter flares.
We present our analysis approach in Sect. 2. Results of the analysis are presented in Sect. 3, including the detection statistics and possible non-1FGL γ-ray counterparts of TANAMI sources. Section 4 is devoted to a discussion of some individual sources. We discuss our results in Sect. 5 and end with our conclusions in Sect. 6.
2. Analysis
2.1. The TANAMI sample
The TANAMI sample analyzed here contains 75 AGN. It is defined as a combined radio and γ-ray selected sample, which includes most radio-loud extragalactic jets south of δ = − 30°, have either been detected at γ-ray energies or are considered candidate γ-ray sources.
The sample of 75 AGN includes the initial TANAMI sample of 43 southern sources. This initial sample consists of a radio-selected, flux-density-limited subsample (with S5 GHz> 2 Jy), a γ-ray selected subsample of known and candidate γ-ray loud jets based on results of CGRO/EGRET, and sources from special classes, such as intraday variable (IDV) and GHz peaked spectrum (GPS) sources. The sample selection and radio properties of the first 43 sources are discussed by Ojha et al. (2010). During the first months of Fermi operation, several southern AGN that are candidate counterparts for LAT sources were added to the initial sample of 43 AGN, resulting in a total of 75 objects in the TANAMI sample. This sample does not include all 101 AGN in this declination range, which have been detected with Fermi/LAT in the 1FGL time range.
Based on their optical properties, the TANAMI sample is classified into quasars (Q), BL Lac objects (B), and galaxies (G). These classifications are based on Véron-Cetty & Véron (2006) and Shaw et al. (2012, 2013) with the exception of a few cases in which we have updated the source classification based on newer references (see Sect. 4). In total, the sample contains 38 quasars, 16 BL Lac objects, and eleven radio galaxies. For the remaining ten sources, no classifications were available because most of them are faint in the optical.
2.2. γ-ray counterparts and upper limits
To study the radio and γ-ray connection, we searched for sources in the TANAMI sample with γ-ray counterparts in the 1FGL catalog. The associations are based on the positional coincidence of radio and γ-ray source positions. The associations used are consistent with those in the 1FGL catalog and its corresponding AGN catalog, 1LAC (Abdo et al. 2010d).
For TANAMI sources without a counterpart in the 1FGL catalog, we calculated upper limits on the γ-ray flux at corresponding radio positions. The upper limits and test statistic (TS) of these sources were obtained by a maximum likelihood analysis (Cash 1979; Mattox et al. 1996), where  is comparable to the significance in σ. We only used photons in the “Source” class of P7_V6 events with energies in the range 100 MeV−100 GeV for the calculation of upper limits. To minimize contamination from Earth’s limb γ-rays, photons with zenith angles greater than 100° were removed. The standard Fermi/LAT ScienceTools software package1 (version v9r23p1) was used with the “P7SOURCE_V6” set of instrument response functions2. The flux, photon index, and TS of each source were determined by analyzing a region of interest (RoI) of 10° in radius centered at the radio position. We modeled the LAT point sources with individual power-law spectra (photon flux dN/ dE = K(E/E0)− Γ). The Galactic diffuse background (gal_2yearp7v6_v0) and the isotropic background (iso_p7v6source) used in the RoI model, including the γ-ray diffuse and residual background of misclassified cosmic rays, are the recommended versions released and described in more detail in the documentation available at the Fermi Science Support Center3. The xml source model for the analyzed region has been created using the 1FGL catalog and a modified version of the tool make2FGLxml.py contributed by T. Johnson, where a source has been added at the radio position for the upper limit calculation. The tool creates a source model including all sources in the RoI as well as sources that are close enough to contribute photons in the RoI because of the instrument response function of Fermi/LAT. Model parameters from the 1FGL catalog are used as default values for every source in the model. We fixed the model parameters of sources outside the RoI to their catalog values, while parameters of sources inside the RoI were variable in the modeling process.
Uncertainties in the LAT effective area represent the major source of systematic error in these results. These uncertainties in the effective area for the IRFs were evaluated by Ackermann et al. (2012) as 10% at 100 MeV, 5% at 560 MeV, and 10% above 10 GeV, linearly varying with the logarithm of energy between those values. The statistical uncertainties exceed these values in all cases. The reported errors on spectral parameters are 1σ uncertainties and only statistical. Following Ackermann et al. (2012), we estimate that the systematic uncertainties are comparable or smaller, ~8% for the fluxes and ~0.1 in photon indices.
In a few cases, this LAT analysis of the unassociated AGN from the TANAMI sample using the enhanced sensitivity of the P7 data provided detections (TS ≥ 25) instead of upper limits (see Sect. 3.2 for more information). For the nondetected sources upper limits on the γ-ray flux have been obtained by fixing the spectral index to Γ = 2.4 and increasing the flux until a ΔTS of 2.71 was reached, which yields an upper limit at the 90% confidence limit. As this method underestimates the upper limit for sources with TS < 1, the Bayesian method (Helene 1983) has been applied in these cases (for more information, see Sect. 4.4 of Abdo et al. 2010c).
Throughout this work, the γ-ray band 100 MeV–100 GeV is used. In our comparisons of γ-ray properties obtained in our analyses with corresponding quantities reported in the LAT catalogs (Nolan et al. 2012), we took values such as spectral index and energy flux directly from these catalogs because the energy ranges analyzed were the same. As the integrated flux in the 100 MeV–100 GeV band is not given directly in the published catalogs, we calculated this value using the flux density at the pivot energy and spectral index (see, e.g., Abdo et al. 2010c, for more information). We obtained the flux uncertainty in this band with the uncertainties of the spectral index and flux density.
2.3. Radio analysis
The VLBI radio analysis of the TANAMI sources follows Ojha et al. (2010), who published results for the initial 43 sources in the sample. We used the first radio epoch for each source with an observation date within the Fermi 1FGL period as representative of the source’s radio flux during the 1FGL period.
We determined brightness temperatures for the radio core at 8.4 GHz in the source frame as described by Ojha et al. (2010), 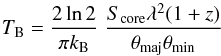 (1)where Score, θmaj, and θmin are the flux density (in Janskys), the semimajor, and semiminor axis of a two-dimensional Gaussian model for the core in the radio image (in milliarcseconds), kB is the Boltzmann constant, z the redshift of the source, and λ the observing frequency. If the size of the fitted model component for the core emission falls below the resolution limit, we calculated lower limits for the brightness temperature following Kovalev et al. (2005). The sources for which only a lower limit on TB can be given are PKS 0717−432, PKS 0812−736, and PKS 1606−667 (see Sect. 3.2).
For a few sources in the sample, no radio properties are presented here because either they were not observed in the 1FGL period or no radio core could be identified in their VLBI image because of an irregular morphology. Although these sources do not contribute to the study of radio and γ-ray emission, we show their γ-ray properties for completeness.
2.4. Gamma-ray luminosities
Assuming the sources have a power-law photon flux spectrum of the form 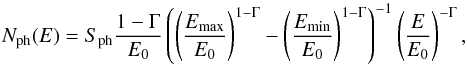 (2)where Sph is the measured photon flux in the energy band from Emin to Emax (E0 is only a reference energy providing a dimensionless base for the noninteger exponent), and where the photon index Γ ≠ 1. The energy flux in that band is given by
 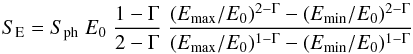 (3)for Γ ≠ 2.
As the sources in the sample are located at different distances, we corrected the measured luminosities using a K-correction following Ghisellini et al. (2009), i.e., 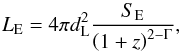 (4)where z is the redshift of the source, SE the energy flux, and Γ the photon spectral index in the γ-ray band. The luminosity distance, dL, was calculated assuming a flat Universe with ΩM = 0.27, ΩΛ = 0.73, and H0 = 71.0 km s-1 Mpc-1.
3. Results
3.1. Detection statistics
The analysis of LAT data revealed different results for different optical classes of AGN. A total of 54 of the 75 AGN from the TANAMI sample can be associated with γ-ray sources from the 1FGL catalog. Table 1 lists the associated AGN. All of the BL Lac objects (16/16) in the sample were detected in the γ-ray regime, and 29 out of 38 quasars were detected, but only two out of eleven radio galaxies have strong enough γ-ray emission to be detected in the eleven months of LAT data we analyzed. The low detection fraction for the radio galaxies is consistent with jet inclination effects and relativistic beaming as predicted by AGN unification (Urry & Padovani 1995). Out of the ten unclassified sources, seven are detected with LAT. The fraction of γ-ray detections of certain source classes is biased by our inhomogeneous sample selection (see Sect. 2.1), e.g., sources have been added from a LAT detection. The added sources include many unclassified objects, whereas the radio galaxies were all included in the initial TANAMI sample.
The two Fermi/LAT-detected radio galaxies are PKS 1322−428 (Cen A) and PKS 0521−365 (ESO 362-G021). Cen A, which is the closest AGN, has the lowest γ-ray luminosity of all associated sources. Gamma-ray emission from its central region and from the giant radio lobes is observed (Abdo et al. 2010a,b). Because of Cen A’s proximity, properties of its jet can be studied with exceptionally high resolution at sub-parsec scales with radio VLBI (see, e.g., Tingay et al. 2001a; Müller et al. 2011, 2014). The other detected radio galaxy, PKS 0521−365, has been suggested to be a BL Lac object based on the properties of its nucleus (see, e.g., Danziger et al. 1979). It was considered as an example of a misaligned radio galaxy with an innermost jet on mas-scales oriented close to the line of sight. Interestingly, Tingay & Edwards (2002) find that this source is likely not “strongly affected by relativistic boosting”. Further TANAMI radio observations will help to clarify the nature of this source by obtaining detailed properties of its inner jet.
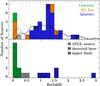 |
Fig. 1 Redshift distribution of LAT detected (top panel) and nondetected sources (bottom panel). The lines in the top panel represent the redshift distributions of all Fermi/LAT-detected AGN (dotted line), of BL Lac objects (dashed line), and quasars (solid line) in the 2LAC, which are shown by a kernel density estimation (KDE) scaled to the corresponding numbers of TANAMI sources. |
Figure 1 shows the distribution of redshifts of Fermi/LAT γ-ray detected and undetected sources (those detected in 1FGL and two detections reported in Sect. 3.2. The third detection does not have a measured redshift). No statistical differences between the redshift distributions of Fermi/LAT-detected and undetected sources of each class are found. A Kolmogorov-Smirnov (KS) two sample test does not indicate a significant difference between the redshift distribution of Fermi/LAT-detected quasars and that of nondetected quasars. The same applies to the radio galaxies. However, we emphasize that for the quasars and radio galaxies in our sample, one of the compared distributions includes only a small number of elements. All radio galaxies in the sample are at low redshifts and the majority of them remain undetected. The comparison of redshift distributions cannot be carried out with BL Lac objects because all sources of this type in the TANAMI sample are detected with Fermi/LAT. Comparing the redshift distribution of the Fermi/LAT-detected AGN in the TANAMI sample with that of all Fermi/LAT-detected AGN given in 2LAC indicates slight differences. Relative to 2LAC, the TANAMI sample contains fewer sources in the moderate redshift regime of around 0.2–0.8. This difference is caused by the selection of the TANAMI sample. Contrary to the 2LAC “Clean Sample” (AGN with Galactic latitude |b| > 10°), which includes 395 BL Lac objects and 310 quasars, the fraction of quasars is larger in the TANAMI sample with 38 quasars but only 16 BL Lac objects. While there is no obvious difference between the redshift distribution of quasars in TANAMI and 2LAC, the flux-limited sample selection of TANAMI seems to favor the nearby BL Lac objects. The distributions of galaxies in 2LAC are not shown separately because of their low number and only small redshifts.
Properties of TANAMI sources associated with 1FGL sources.
3.2. Possible non-1FGL gamma-ray counterparts
For sample sources without 1FGL γ-ray counterparts, we calculated upper limits on the γ-ray flux as described in Sect. 2.2, using the first eleven months of Fermi/LAT data. For some radio sources, this analysis revealed significant γ-ray emission at the radio position. We modeled sources with TS ≥ 25 (Table 2) and calculated upper limits for less significant sources (Table 3).
Properties of additional γ-ray detections of TANAMI sources in the 1FGL period.
The detection of additional γ-ray sources not included in the 1FGL catalog benefited from our usage of the Galactic and extragalactic background models obtained during the first two years of Fermi operations, as well as the improved instrument response functions.
Two quasars (PKS 2149−306 and PKS 2326−477) and one source with unknown optical counterpart (PKS 1505−495) were detected with TS ≥ 25, i.e., they met the detection threshold for the LAT source catalogs. All three of these detections confirm analysis by the Fermi/LAT team in the second year Fermi/LAT-catalog (2FGL; Nolan et al. 2012) and its AGN counterpart, 2LAC (Ackermann et al. 2011b).
Upper limits on the γ-ray emission of TANAMI sources not associated with 1FGL sources.
3.3. Gamma-ray properties of the TANAMI sample
Figure 2 shows the γ-ray flux distribution of the sources in the TANAMI sample. The large number of unclassified sources mostly results from the addition of new Fermi detections that are disproportionally fainter and thus less well studied at other frequencies. The flux and the spectral index are averaged over the first eleven months of Fermi science operations. Given the different source distances it is in general difficult to discern any clear connection between source type and γ-ray flux. The flux distributions of the AGN in 2LAC and in the TANAMI sample are clearly different, as the sample selection led to a much higher fraction of bright γ-ray sources.
The distribution of spectral indices is shown in Fig. 3. Typical uncertainties are in the range of ± 0.1 (Table 1). There is an indication that BL Lacs tend to have, on average, harder spectra than quasars, which is consistent with earlier Fermi results (Abdo et al. 2010d, their Fig. 12). With a KS two sample test, we obtain a probability of 0.1% that the γ-ray spectral indices of BL Lac objects have the same distribution as those of quasars. This result is consistent with previous studies in which a relation between the gamma-ray spectral index and the peak frequency of the synchrotron component in the spectral energy distribution has been found. The BL Lac objects are generally categorized as low-, intermediate- and high-synchrotron peaked sources (LSP, ISP, and HSP) that exhibit softer gamma-ray spectra with decreasing peak frequency (see, e.g., Fig. 17 of Ackermann et al. 2011b). This sequence extends to the quasars with the softest observed gamma-ray spectra.
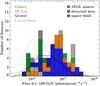 |
Fig. 2 Flux distribution of the Fermi/LAT-detected sources. For comparison the flux distributions of all 2LAC AGN (dotted line), 2LAC quasars (solid line) and 2LAC BL Lacs (dashed line) are shown as in Fig. 1. |
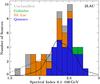 |
Fig. 3 Distribution of the γ-ray spectral indices Γ of the Fermi/LAT-detected sources. The lines indicate the distributions of spectral indices of quasars (solid line) and BL Lac objects (dashed line) in the 2LAC (using a KDE as in Fig. 1). |
The observed γ-ray luminosities (calculated as described in Sect. 2.4 and using a spectral index of Γ = 2.4 for the upper limits) show a clear dependence on the source classification (Fig. 4). Luminosities are low for radio galaxies, mostly intermediate for BL Lac objects, and high for quasars.
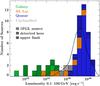 |
Fig. 4 Distribution of γ-ray luminosities. Radio galaxies have low luminosities, BL Lac objects are brighter, and quasars the brightest objects in the sample. For comparison the luminosity distributions of quasars and BL Lac objects in the 2LAC are shown with the solid and dashed line, respectively (using a KDE as in Fig. 1). |
The distribution of upper limits for the luminosity is consistent with that of the detected sources. The limits for the radio galaxies are clearly above the luminosity of Cen A ((1.3 ± 0.1) × 1041 erg s-1), which is the source with the lowest measured γ-ray luminosity in the sample. Upper limits for the quasars in the sample are not larger than the measured values but seem to have a similar distribution. A two-sample KS test does not indicate a significant statistical difference between both distributions (the probability that upper limits and luminosities of detected sources have the same underlying distribution is 19%).
The relation between the γ-ray luminosity and the spectral index is shown in Fig. 5 (this relation for all Fermi/LAT-detected AGN is shown in Fig. 24 of Abdo et al. 2010d). The Pearson correlation coefficient between both quantities (including the sources detected in the upper limit analysis) is 0.19. This value is comparable to the value of 0.17 found by Abdo et al. (2010d), who point out that the correlation might be influenced by instrumental detection limits and the Malmquist bias.
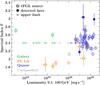 |
Fig. 5 Gamma-ray luminosities and spectral indices for different source classes. The upper limits are shown with the average index of Γ = 2.4. |
3.4. Radio-gamma-ray relations
The core flux and brightness temperature of the core for each TANAMI source were calculated using the results of the radio VLBI imaging (see Sect. 2.3). These radio properties were compared with the γ-ray properties. Figure 6 shows the relation of γ-ray flux and the 8.4 GHz radio core flux density. To quantify correlations, we calculated Kendall’s τ rank correlation coefficient for censored data (considering determined pairs only; Helsel 2005). Including the upper limits in this way the correlation coefficient is 0.29 with a p-value of 3.2 × 10⁻⁵, confirming the correlation between these quantities.
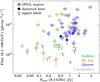 |
Fig. 6 Relation between γ-ray and radio core flux. |
The luminosities were calculated as described in Sect. 2.4 with the distances and spectral indices of the sources. The relation between the radio and γ-ray luminosity is shown in Fig. 7.
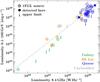 |
Fig. 7 Relation between γ-ray and radio core luminosity. The dashed line shows the fitted power-law relation between both luminosities. Upper limits tend to be below this relation. |
Fitting a linear function to the logarithm of the luminosities yields  . The clear correlation between the luminosities is induced by the source distances; thus the method of Akritas & Siebert (1996) is used, which yields a partial correlation coefficient of 0.30 with a p-value of 4.3 × 10⁻³ between radio and γ-ray luminosity given the redshift. These values mainly reflect the correlation between the fluxes. It is, however, necessary to consider that most of the sources show significant variability in both energy bands and that there might be source-dependent time delays between both bands. For that reason the obtained degree of correlation might be decreased unless corresponding time periods are used for the observations in both energy bands.
Figures 6 and 7 show that the ratio of γ-ray to radio brightness is larger for TANAMI sources that are detected with Fermi than for the Fermi/LAT- undetected sources in the sample, where the upper limit is used as the flux. A significant statistical difference between the distributions of the luminosity ratios of Fermi/LAT detected and undetected sources is found. A two-sample KS test yields a probability of only 1.2% that both ratios were drawn from the same underlying distribution.
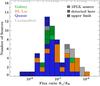 |
Fig. 8 Distribution of the ratio between γ-ray and radio core flux. The stacked histogram is color-coded according to the source class. |
The γ-ray loudness, which is defined here simply as the ratio of the integral γ-ray flux to the radio flux density of the VLBI core, is presented in Fig. 8 for the AGN in the sample. The distribution of the γ-ray loudness indicates a similar dependence on the source class as the γ-ray spectral index distribution: while the quasars are less γ-ray loud, the BL Lac objects cover a broader range with a slightly higher averaged γ-ray loudness. This dependence is consistent with a shift of the peak frequencies in the SEDs. If the synchrotron peak is shifted to higher frequencies the flux density in the radio band decreases, whereas a shift of the high-energy peak in the SED toward higher frequencies increases the flux in the observed γ-ray band. At the same time the spectrum in this band hardens. This interpretation is strengthened by an observed anticorrelation between the γ-ray spectral index, Γ, and the γ-ray loudness as it is defined here (Fig. 9). We obtain a p-value of 1.0% for a Kendall τ rank correlation.
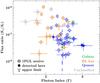 |
Fig. 9 Scatter plot of γ-ray loudness (defined here as a flux ratio) and γ-ray spectral index. |
Figure 10 shows the distribution of the brightness temperatures. The distribution is consistent with that obtained from the first TANAMI observations shown by Ojha et al. (2010). A similar distribution of brightness temperatures is also seen in the MOJAVE survey (Kovalev et al. 2009). The highest observed value is above 1013 K. Because of the theoretical limits on the brightness temperature in the source frame, such as the inverse Compton limit of ~1012 K (Kellermann & Pauliny-Toth 1969), the larger brightness temperatures observed here are a clear indication of strong Doppler boosting (as discussed, e.g., by Tingay et al. 2001b).
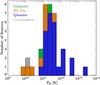 |
Fig. 10 Distribution of brightness temperatures in the TANAMI sample. |
The relation between brightness temperatures and the γ-ray luminosity is shown in Fig. 11. There is an indication that the brightness temperature of the radio core increases with increasing γ-ray luminosity.
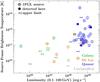 |
Fig. 11 Relation between γ-ray luminosity and brightness temperature of the radio core. |
The partial correlation coefficient between γ-ray luminosity and brightness temperature, given the redshift, is 0.25 with a p-value of 1.8 × 10⁻³. Fermi/LAT undetected sources, of which a large fraction have a low ratio of γ-ray to radio luminosity (Fig. 7), also tend to have lower brightness temperatures.
4. Individual sources
In this section we comment on sources for which a classification has been added and/or the Véron-Cetty & Véron (2006) classification has been changed. Additionally, sources where our γ-ray analysis revealed new results are discussed.
[HB89] 0208−512:
we use a classification as quasar instead of the BL Lac classification because Wilkes (1986) find a Mgii line with an equivalent width of 18 Å.
PKS 0302−623:
we use a quasar classification for this object, as it has properties of a flat spectrum radio quasar (see, e.g., Healey et al. 2008).
[HB89] 0332−403:
the redshift of this source, which is by far the most luminous BL Lac in our sample, is difficult to determine. We use z = 1.351, which is based on a single weak Mg ii emission line (Bergeron et al. 2011) and is consistent with the photometric redshift of this source (Rau et al. 2012,  ). If the source classification as a BL Lac is correct, PKS 0332−403 would be one of only two BL Lac objects with z> 1.3 in the Fermi 2FGL sample (Rau et al. 2012).
However, the classification of this source as a BL Lac by Véron-Cetty & Véron (2006) does not seem to be very secure. It seems to go back to Impey & Tapia (1990), who found that PKS 0332−403 has a high degree of polarization (14.7%) above their 2.5% for classifying sources as blazars, but little further work appears to have been done on classifying PKS 0332−403. The more specialized catalog of BL Lacs by Padovani & Giommi (1995) did not contain PKS 0332−403. The updated version of that catalog, version 4.2 of the Roma-BZCAT catalog (Massaro et al. 2009), lists PKS 0332−403 as only a “BL Lac candidate”. Torniainen et al. (2008) and Tornikoski et al. (2001) are more conservative and list PKS 0332−403 as a highly polarized quasar and possibly a GPS source.
[HB89] 0438−436:
this is a very bright and luminous radio quasar at high redshift (z = 2.863) that was not detected in the first eleven months of Fermi/LAT data. The upper limit on the luminosity, given by the flux upper limit and the distance, is, however, in the range of a relatively luminous quasar.
PKS 0447−439:
we do not use a redshift for this source because it is uncertain and some of its estimates are even contradictory, as discussed by Pita et al. (2014).
ESO 362-G021 (0521−365):
instead of a BL Lac classification we use a galaxy classification based on the presence of strong emission lines (see, e.g., Falomo et al. 1994).
PKS 0625−354:
this source has a large-scale FR-I radio morphology, but its optical spectrum indicates a BL Lac classification (Wills et al. 2004), which we use in this work. PKS 0625−354 is one of five misaligned radio galaxies discussed in the 1LAC (Abdo et al. 2010d). The TANAMI mas-scale image shows a single-sided jet with a strong core component and is thus consistent with the inner parsec-scale jet being oriented close to the line of sight.
PKS 0745−330
has a nearby 1FGL source, but the radio position is slightly outside the positional 95% confidence region of the 1FGL source indicating that it might not be the correct counterpart. In the 2FGL catalog (2FGL; Nolan et al. 2012) the separation is, however, smaller and the radio and 2FGL sources are associated. As the 1FGL and 2FGL sources are clearly associated, we use the 1FGL as counterpart for 0745−330 here. Testing the other case in which the γ-ray source is not the correct counterpart for 0745−330, the modeling of a γ-ray source at the radio position, in addition to the nearby 1FGL source, yields a TS of 12.7 and a flux of ≤0.6 × 10⁻⁷ ph cm-2 s-1.
PKS 1057−79:
Sbarufatti et al. (2009), who measured the redshift of z = 0.581 of this source, list PKS 1057−79 as a BL Lac object but suggest classifying it as a broad-line AGN based on the observed emission lines. We use the BL Lac classification. The γ-ray luminosity and spectral index of this object are in between the typical values for quasars and BL Lacs.
ESO 443-G024 (1258−321):
this is the brightest galaxy in the cluster ACO 3537 (Hudson et al. 2001), but has blazar properties as well. With a TS below 25 the source is not detected by Fermi/LAT. Modeling the source yields a TS of 18.2, a flux of (1.6 ± 0.8) × 10-8 ph cm-2 s-1, and a spectral index 2.33 ± 0.22.
PKS 1440−389:
PKS 1440−389 has a very hard γ-ray spectrum with spectral index of 1.83 ± 0.08. A BL Lac classification is likely (see, e.g., Jackson et al. 2002; Mao 2011). The TANAMI VLBI image reveals a weak radio core with SCore ~ 50 mJy and an extension to the southwest.
PMN J1508−4953:
this source, which was not in 1FGL, was detected in our analysis. Modeling a γ-ray source at the radio position of that source yields a TS of 68, a flux of (4.0 ± 0.9) × 10-8 ph cm-2 s-1, and a spectral index 2.18 ± 0.09. These values are consistent with the source’s counterpart in the 2FGL catalog (2FGL J1508.5−4957). The properties obtained during the first two years of Fermi operation are TS = 70, a flux of Sph = (5.5 ± 0.9) × 10-8 ph cm-2 s-1 and a spectral index of 2.61 ± 0.09.
PKS 2149−306:
this source is clearly detected in the γ-ray data with a TS of 61, a flux of (5.1 ± 0.9) × 10-8 ph cm-2 s-1, and a very soft spectral index of 2.99 ± 0.16. With this value, the source has one of the steepest gamma-ray spectra of all AGN detected with Fermi/LAT. The source is included in the 2FGL catalog as 2FGL J2151.5−3021 and has the following properties averaged over the first two years of Fermi: TS = 168, Sph = (6.4 ± 0.7) × 10-8 ph cm-2 s-1 and a spectral index of 3.00 ± 0.09.
[HB89] 2326−477
is detected with a TS of 27, a flux of (3.0 ± 1.0) × 10-8 ph cm-2 s-1, and a spectral index of 3.0 ± 0.4. The source is included in 2FGL as 2FGL J2329.7−4744 with TS = 25 and a flux of Sph = (1.6 ± 0.7) × 10-8 ph cm-2 s-1. The spectral index is 2.58 ± 0.22. With a flux of (7.7 ± 2.0) × 10-8 ph cm-2 s-1, this source was brightest in the tenth of the 24 monthly bins in the 2FGL catalog. The variability explains the slightly higher TS and flux average in the 1FGL period compared to the full 2FGL period.
5. Discussion
We present γ-ray properties of the TANAMI sample based on the data obtained with Fermi/LAT during its first eleven months of operation. A total of 54 out of the 75 AGN from this sample can be associated with γ-ray sources from the 1FGL catalog. All BL Lac objects (16/16) and a large fraction of quasars (29/38) are detected in the γ-ray regime, whereas from the eleven radio galaxies only the closest one (Cen A) and one with indications of being a BL Lac object (PKS 0521−365) were detected with Fermi/LAT. The low number of γ-ray detected radio galaxies is consistent with 1LAC and 2LAC where the dominating fraction of Fermi/LAT-detected AGN are blazars. In 2LAC the “clean” sample of 886 AGN includes 395 BL Lac objects and 310 quasars but only eight misaligned AGN (Ackermann et al. 2011b). There does not appear to be a significant difference in the distribution of redshifts for Fermi/LAT detected and nondetected sources as was also found for the MOJAVE sample (Lister et al. 2011).
For the 21 AGN without γ-ray counterparts we presented upper limits on the γ-ray flux. In three cases (PKS 1505−496, PKS 2149−306, PKS 2326−477) the TS was high enough to indicate a detection. All of these three sources are included as detections in the 2FGL catalog. The upper limits on γ-ray luminosity for quasars in the sample are comparable to the measured values and both the limits and values have a similar distribution. This suggests that the luminosity of the undetected quasars is comparable to their upper limits. Alternatively, there could be a class of fainter (at γ-ray energies) quasars in the sample.
A weak correlation between radio and γ-ray fluxes, as well as an analogous partial correlation between the luminosities, of the sources in the TANAMI sample has been found in the first eleven months of Fermi science operations (see Figs. 6 and 7). Using EGRET data, Bloom (2008) found a correlation between the γ-ray and the radio luminosity at 8.4 GHz of  . They were able to reproduce this relation with a synchrotron self-Compton model, but not with an external Compton model. Studies with Fermi/LAT data have shown that the γ-ray flux correlates well with compact (parsec scale) radio flux (Kovalev et al. 2009). For the TANAMI sample we find a relation of
  . A detailed interpretation of such a relation is difficult because the emission in both bands is variable on different timescales and thus the ratio between the radio and γ-ray luminosity is not even constant for individual sources. With a longer set of contemporaneous observations, this problem could be addressed by searching for delays or specifying well-justified averaging times. A perfect correlation between radio and γ-ray luminosity is, however, not expected, as it can be easily weakened, e.g., by different Doppler boosting in the radio and γ-ray regime. Different boosting between both energy regimes can, for example, originate from different Lorentz factors in the case of separated emission regions, but also from different spectral slopes in the radio and γ-ray regimes. For that reason, different angles to the line of sight of different sources in a sample decrease the observed correlation between the fluxes (e.g., Lister 2007). Varying contributions of external Comptonization further scatters the radio γ-ray relation. The fact that only weak correlations are found between the average radio and gamma-ray flux agrees with correlated variability being observed only rarely in both bands (see, e.g., Max-Moerbeck et al. 2013).
We find that BL Lacs in our sample tend to have harder spectra than quasars. Early Fermi results, as well as the 2LAC, show γ-ray loud quasars have soft spectra while the BL Lacs have a diverse range of spectral indices, where the gamma-ray spectra soften from HSP over ISP to LSP BL Lac objects (Ackermann et al. 2011b; Lott et al. 2012). The ratio of γ-ray and radio flux, which is used here to characterize the γ-ray loudness, is anticorrelated with the spectral index in the γ-ray band, which is consistent with the above-mentioned dependence on the synchrotron peak frequency.
Most γ-ray upper limits for undetected sources tend to be smaller than required for fitting to the average radio-γ-ray relation in the sample, i.e., many of the Fermi/LAT-undetected AGN are less γ-ray-loud than the detected sources. However, we stress that the derived γ-ray loudness can be influenced by variability. As shown by Abdo et al. (2010d, their Figs. 11 and 19), most AGN show strong variability in the γ-ray regime. Flares can greatly increase the measured average flux. Additionally, the sources are variable in the radio regime. Considering possible emission delays between the bands, the selection of corresponding time intervals is necessary for a better correlation. (Pushkarev et al. 2010, find delays of about 1.2 months in the source frame). Further temporal studies, including a search for delays and a comparison of the jet speeds with γ-ray properties, will be carried out with more TANAMI epochs over a longer time period.
We find indications that γ-ray luminous AGN in the TANAMI sample have larger radio core brightness temperatures than γ-ray fainter sources. A comparison of brightness temperatures of strong EGRET sources and EGRET-undetected sources did not show this relation (Tingay et al. 1998, who used mainly observations at lower frequencies). A relation between brightness temperature and γ-ray brightness has been found in the MOJAVE sample (Kovalev et al. 2009; Lister et al. 2011).
6. Conclusions
The radio and γ-ray properties of the TANAMI AGN sample were investigated with data obtained during the first eleven months of Fermi operations. More than 70% of the sample had already been detected by Fermi/LAT and the rates of detection for quasars and radio galaxies are consistent with those found in other samples and with studies using more γ-ray data.
For those TANAMI sources not in the 1FGL list, an upper limit analysis was performed. Three new γ-ray sources were significantly detected by this analysis. The luminosities of the rest of the undetected quasars are likely to be close to the upper limits reported here. The undetected sources have lower γ-ray-to-radio luminosity ratio and lower brightness temperatures, which fits the picture of Doppler boosting playing a dominant role in determining the γ-ray state of an AGN.
A relation between γ-ray and radio flux was apparent and the brightness temperatures of radio cores were found to scale with the γ-ray luminosity. Some sources have brightness temperatures well above the inverse Compton limit suggesting strong Doppler boosting.
Similar studies of the TANAMI sample will be made using LAT data for different time ranges to tease out variations on different timescales. As enough epochs of data are now becoming available for most of the TANAMI sample, future studies will include VLBI kinematics. The TANAMI team has upcoming observations with Gemini South, which should facilitate optical identifications and redshift measurements for the large fraction of TANAMI sources (mostly fainter and poorly studied new Fermi/LAT detections) that do not have them, which will significantly improve our statistics.
The 1FGL analysis was carried out using the P6_V3 events and response functions. We used the 1FGL results because the fluxes and spectral indices did not change significantly with the P7 analysis, as shown by the 2FGL catalog (Nolan et al. 2012).
Acknowledgments
This research has been partially funded by the Bundesministerium für Wirtschaft und Technologie under Deutsches Zentrum für Luft- und Raumfahrt grant number 50OR0808. The Long Baseline Array is part of the Australia Telescope, which is funded by the Commonwealth of Australia for operation as a National Facility managed by CSIRO. E.R. acknowledges partial support by the Spanish MINECO grants AYA2009-13036-C02-C02 and AYA2012-38491-C02-01, by the Generalitat Valenciana grant Prometeo 2009/104, and by the COST action MP0905 “Black Holes in a Violent Universe”. This research was funded in part by NASA through Fermi Guest Investigator grant NNH09ZDA001N (proposal number 31263) and grant NNH10ZDA001N (proposal number 41213). This research was supported by an appointment to the NASA Postdoctoral Program at the Goddard Space Flight Center, administered by Oak Ridge Associated Universities through a contract with NASA. The Fermi/LAT Collaboration acknowledges generous ongoing support from a number of agencies and institutes that have supported both the development and operation of the LAT as well as scientific data analysis. These include the National Aeronautics and Space Administration and the Department of Energy in the United States, the Commissariat à l’Énergie Atomique and the Centre National de la Recherche Scientifique/Institut National de Physique Nucléaire et de Physique des Particules in France, the Agenzia Spaziale Italiana and the Istituto Nazionale di Fisica Nucleare in Italy, the Ministry of Education, Culture, Sports, Science and Technology (MEXT), High Energy Accelerator Research Organization (KEK) and Japan Aerospace Exploration Agency (JAXA) in Japan, and the K.A. Wallenberg Foundation, the Swedish Research Council and the Swedish National Space Board in Sweden. Additional support for science analysis during the operations phase is gratefully acknowledged from the Istituto Nazionale di Astrofisica in Italy and the Centre National d’Études Spatiales in France. This research has made use of NASA’s Astrophysics Data System Bibliographic Services. This research has made use of the NASA/IPAC Extragalactic Database (NED), which is operated by the Jet Propulsion Laboratory, California Institute of Technology, under contract with the National Aeronautics and Space Administration. We thank John E. Davis for the development of the SLxfig module used to prepare the figures in this paper. This research has made use of ISIS functions provided by ECAP/Remeis observatory and MIT (http://www.sternwarte.uni-erlangen.de/isis/). We thank Davide Donato and Seth Digel for their very helpful comments.
References
- Abdo, A. A., Ackermann, M., Ajello, M., et al. 2010a, ApJ, 719, 1433 [NASA ADS] [CrossRef] [Google Scholar]
- Abdo, A. A., Ackermann, M., Ajello, M., et al. 2010b, Science, 328, 725 [NASA ADS] [CrossRef] [PubMed] [Google Scholar]
- Abdo, A. A., Ackermann, M., Ajello, M., et al. 2010c, ApJS, 188, 405 [NASA ADS] [CrossRef] [Google Scholar]
- Abdo, A. A., Ackermann, M., Ajello, M., et al. 2010d, ApJ, 715, 429 [NASA ADS] [CrossRef] [Google Scholar]
- Ackermann, M., Ajello, M., Allafort, A., et al. 2011a, ApJ, 741, 30 [NASA ADS] [CrossRef] [Google Scholar]
- Ackermann, M., Ajello, M., Allafort, A., et al. 2011b, ApJ, 743, 171 [NASA ADS] [CrossRef] [Google Scholar]
- Ackermann, M., Ajello, M., Albert, A., et al. 2012, ApJS, 203, 4 [NASA ADS] [CrossRef] [Google Scholar]
- Ackermann, M., Ajello, M., Atwood, W. B., et al. 2015, ApJ, 810, 14 [NASA ADS] [CrossRef] [Google Scholar]
- Akritas, M. G., & Siebert, J. 1996, MNRAS, 278, 919 [NASA ADS] [CrossRef] [Google Scholar]
- Atwood, W. B., Abdo, A. A., Ackermann, M., et al. 2009, ApJ, 697, 1071 [NASA ADS] [CrossRef] [Google Scholar]
- Bergeron, J., Boissé P., & Ménard B., 2011, A&A, 525, A51 [NASA ADS] [CrossRef] [EDP Sciences] [Google Scholar]
- Blandford, R. D., & Rees, M. J. 1978, in BL Lac Objects, ed. A. M. Wolfe, 328 [Google Scholar]
- Bloom, S. D. 2008, AJ, 136, 1533 [NASA ADS] [CrossRef] [Google Scholar]
- Cash, W. 1979, ApJ, 228, 939 [NASA ADS] [CrossRef] [Google Scholar]
- Cohen, M. H., Lister, M. L., Homan, D. C., et al. 2007, ApJ, 658, 232 [NASA ADS] [CrossRef] [Google Scholar]
- Danziger, I. J., Fosbury, R. A. E., Goss, W. M., & Ekers, R. D. 1979, MNRAS, 188, 415 [NASA ADS] [Google Scholar]
- Falomo, R., Scarpa, R., & Bersanelli, M. 1994, ApJS, 93, 125 [NASA ADS] [CrossRef] [Google Scholar]
- Fossati G., Maraschi L., Celotti A., et al. 1998, MNRAS, 299, 433 [NASA ADS] [CrossRef] [Google Scholar]
- Ghisellini, G., Maraschi, L., & Tavecchio, F. 2009, MNRAS, 396, L105 [NASA ADS] [Google Scholar]
- Ghisellini G., Tavecchio F., Foschini L. et al. 2010, MNRAS, 402, 497 [NASA ADS] [CrossRef] [Google Scholar]
- Hartman, R. C., Bertsch, D. L., Fichtel, C. E. et al. 1992, ApJ, 385, L1 [NASA ADS] [CrossRef] [Google Scholar]
- Healey, S. E., Romani, R. W., Cotter, G., et al. 2008, ApJS, 175, 97 [NASA ADS] [CrossRef] [Google Scholar]
- Helene, O. 1983, Nucl. Instr. Meth. Phys. Res., 212, 319 [Google Scholar]
- Helsel, D. R. 2005, Nondetects and Data Analysis: Statistics for Censored Environmental Data (New York: Wiley) [Google Scholar]
- Hudson, M. J., Lucey, J. R., Smith, R. J., et al. 2001, MNRAS, 327, 265 [NASA ADS] [CrossRef] [Google Scholar]
- Impey, C. 1996, AJ, 112, 2667 [NASA ADS] [CrossRef] [Google Scholar]
- Impey, C. D., & Tapia, S. 1990, ApJ, 354, 124 [NASA ADS] [CrossRef] [Google Scholar]
- Jackson, C. A., Wall, J. V., Shaver, P. A., et al. 2002, A&A, 386, 97 [NASA ADS] [CrossRef] [EDP Sciences] [Google Scholar]
- Kellermann, K. I., & Pauliny-Toth, I. I. K. 1969, ApJ, 155, L71 [NASA ADS] [CrossRef] [Google Scholar]
- Kovalev, Y. Y., Kellermann, K. I., Lister, M. L., et al. 2005, AJ, 130, 2473 [NASA ADS] [CrossRef] [Google Scholar]
- Kovalev, Y. Y., Aller, H. D., Aller, M. F., et al. 2009, ApJ, 696, L17 [NASA ADS] [CrossRef] [Google Scholar]
- León-Tavares J., Valtaoja, E., Tornikoski, M., et al. 2011, A&A, 532, A146 [NASA ADS] [CrossRef] [EDP Sciences] [Google Scholar]
- Linford, J. D., Taylor, G. B., Schinzel, F. K. 2012, ApJ, 757, 25 [NASA ADS] [CrossRef] [Google Scholar]
- Lister, M. L. 2007, in The First GLAST Symposium, eds. S. Ritz, P. Michelson, C. A. Meegan, AIP Conf., 921, 345 [NASA ADS] [CrossRef] [Google Scholar]
- Lister, M. L., & Homan, D. C. 2005, AJ, 130, 1389 [NASA ADS] [CrossRef] [Google Scholar]
- Lister, M. L., Homan, D. C., Kadler, M., et al. 2009, ApJ, 696, L22 [NASA ADS] [CrossRef] [Google Scholar]
- Lister, M. L., Aller, M., Aller, H., et al. 2011, ApJ, 742, 27 [NASA ADS] [CrossRef] [Google Scholar]
- Lister, M. L., Aller, M. F., Aller, H. D., et al. 2013, AJ, 146, 120 [NASA ADS] [CrossRef] [Google Scholar]
- Lott, B., Cavazzuti, E., Cutini, S., et al. 2012, in Proc. Fermi & Jansky, eConf C1111101 [Google Scholar]
- Lovell, J. E. J., McCallum, J. N., Reid, P. B., et al. 2013, J. Geodesy, 87, 527 [NASA ADS] [CrossRef] [Google Scholar]
- Mao, L. S., 2011, New Astron., 16, 503 [NASA ADS] [CrossRef] [Google Scholar]
- Maraschi, L., Ghisellini, G., & Celotti, A. 1992, ApJ, 397, L5 [NASA ADS] [CrossRef] [Google Scholar]
- Massaro, E., Giommi, P., Leto, C., et al. 2009, A&A, 495, 691 [NASA ADS] [CrossRef] [EDP Sciences] [Google Scholar]
- Mattox, J. R., Bertsch, D. L., Chiang, J., et al. 1996, ApJ, 461, 396 [NASA ADS] [CrossRef] [Google Scholar]
- Max-Moerbeck, W., Richards, J. L., Pavlidou, V., et al. 2013, in 2012 Fermi Symp. Proc., eConf C121028 [Google Scholar]
- Moellenbrock, G. A., Fujisawa, K., Preston, R. A., et al. 1996, AJ, 111, 2174 [NASA ADS] [CrossRef] [Google Scholar]
- Müller C., Kadler, M., Ojha, R., et al. 2011, A&A, 530, L11 [NASA ADS] [CrossRef] [EDP Sciences] [Google Scholar]
- Müller C., Kadler M., Ojha R., et al. 2014, A&A, 569, A115 [NASA ADS] [CrossRef] [EDP Sciences] [Google Scholar]
- Nolan, P. L., Abdo, A. A., Ackermann, M., et al. 2012, ApJS, 199, 31 [NASA ADS] [CrossRef] [Google Scholar]
- Ojha, R., Fey, A. L., Johnston, K. J., et al. 2004, AJ, 127, 1977 [NASA ADS] [CrossRef] [Google Scholar]
- Ojha, R., Kadler, M., Böck M., et al. 2010, A&A, 519, A45 [NASA ADS] [CrossRef] [EDP Sciences] [Google Scholar]
- Padovani, P., & Giommi, P. 1995, MNRAS, 277, 1477 [NASA ADS] [CrossRef] [Google Scholar]
- Pita, S., Goldoni, P., Boisson, C., et al. 2014, A&A, 565, A12 [NASA ADS] [CrossRef] [EDP Sciences] [Google Scholar]
- Pushkarev, A. B., Kovalev, Y. Y., & Lister, M. L., 2010, ApJ, 722, L7 [NASA ADS] [CrossRef] [Google Scholar]
- Rau, A., Schady, P., Greiner, J., et al. 2012, A&A, 538, A26 [NASA ADS] [CrossRef] [EDP Sciences] [Google Scholar]
- Sbarufatti, B., Ciprini, S., Kotilainen, J., et al. 2009, AJ, 137, 337 [NASA ADS] [CrossRef] [Google Scholar]
- Shaw, M. S., Romani, R. W., Cotter, G., et al. 2012, ApJ, 748, 49 [CrossRef] [Google Scholar]
- Shaw, M. S., Filippenko, A. V., Romani, R. W., et al. 2013, AJ, 146, 127 [NASA ADS] [CrossRef] [Google Scholar]
- Tavecchio, F., Ghisellini, G., Bonnoli, G., & Ghirlanda, G. 2010, MNRAS, 405, L94 [NASA ADS] [CrossRef] [Google Scholar]
- Taylor, G. B., Healey, S. E., Helmboldt, J. F., et al. 2007, ApJ, 671, 1355 [NASA ADS] [CrossRef] [Google Scholar]
- Thompson, D. J., Bertsch, D. L., Fichtel, C. E., et al. 1993, ApJS, 86, 629 [NASA ADS] [CrossRef] [Google Scholar]
- Tingay, S. J., & Edwards, P. G. 2002, AJ, 124, 652 [NASA ADS] [CrossRef] [Google Scholar]
- Tingay, S. J., Murphy, D. W., Lovell, J. E. J., et al. 1998, ApJ, 497, 594 [NASA ADS] [CrossRef] [Google Scholar]
- Tingay, S. J., Preston, R. A., & Jauncey, D. L. 2001a, AJ, 122, 1697 [NASA ADS] [CrossRef] [Google Scholar]
- Tingay, S. J., Preston, R. A., Lister, M. L., et al. 2001b, ApJ, 549, L55 [NASA ADS] [CrossRef] [Google Scholar]
- Tingay, S. J., Jauncey, D. L., King, E. A., et al. 2003, PASJ, 55, 351 [NASA ADS] [Google Scholar]
- Torniainen, I., Tornikoski, M., Turunen, M., et al. 2008, A&A, 482, 483 [NASA ADS] [CrossRef] [EDP Sciences] [Google Scholar]
- Tornikoski, M., Jussila, I., Johansson, P., et al. 2001, AJ, 121, 1306 [NASA ADS] [CrossRef] [Google Scholar]
- Tzioumis, A. K., Tingay, S. J., Stansby, B., et al. 2010, AJ, 140, 1506 [NASA ADS] [CrossRef] [Google Scholar]
- Urry, C. M., & Padovani, P. 1995, PASP, 107, 803 [NASA ADS] [CrossRef] [Google Scholar]
- Véron-Cetty M. P., & Véron P. 2006, A&A, 455, 773 [NASA ADS] [CrossRef] [EDP Sciences] [Google Scholar]
- Wilkes, B. J. 1986, MNRAS, 218, 331 [NASA ADS] [CrossRef] [Google Scholar]
- Wills, K. A., Morganti, R., Tadhunter, C. N., et al. 2004, MNRAS, 347, 771 [NASA ADS] [CrossRef] [Google Scholar]
All Tables
Upper limits on the γ-ray emission of TANAMI sources not associated with 1FGL sources.
All Figures
|
Fig. 1 Redshift distribution of LAT detected (top panel) and nondetected sources (bottom panel). The lines in the top panel represent the redshift distributions of all Fermi/LAT-detected AGN (dotted line), of BL Lac objects (dashed line), and quasars (solid line) in the 2LAC, which are shown by a kernel density estimation (KDE) scaled to the corresponding numbers of TANAMI sources. |
| In the text | |
|
Fig. 2 Flux distribution of the Fermi/LAT-detected sources. For comparison the flux distributions of all 2LAC AGN (dotted line), 2LAC quasars (solid line) and 2LAC BL Lacs (dashed line) are shown as in Fig. 1. |
| In the text | |
|
Fig. 3 Distribution of the γ-ray spectral indices Γ of the Fermi/LAT-detected sources. The lines indicate the distributions of spectral indices of quasars (solid line) and BL Lac objects (dashed line) in the 2LAC (using a KDE as in Fig. 1). |
| In the text | |
|
Fig. 4 Distribution of γ-ray luminosities. Radio galaxies have low luminosities, BL Lac objects are brighter, and quasars the brightest objects in the sample. For comparison the luminosity distributions of quasars and BL Lac objects in the 2LAC are shown with the solid and dashed line, respectively (using a KDE as in Fig. 1). |
| In the text | |
|
Fig. 5 Gamma-ray luminosities and spectral indices for different source classes. The upper limits are shown with the average index of Γ = 2.4. |
| In the text | |
|
Fig. 6 Relation between γ-ray and radio core flux. |
| In the text | |
|
Fig. 7 Relation between γ-ray and radio core luminosity. The dashed line shows the fitted power-law relation between both luminosities. Upper limits tend to be below this relation. |
| In the text | |
|
Fig. 8 Distribution of the ratio between γ-ray and radio core flux. The stacked histogram is color-coded according to the source class. |
| In the text | |
|
Fig. 9 Scatter plot of γ-ray loudness (defined here as a flux ratio) and γ-ray spectral index. |
| In the text | |
|
Fig. 10 Distribution of brightness temperatures in the TANAMI sample. |
| In the text | |
|
Fig. 11 Relation between γ-ray luminosity and brightness temperature of the radio core. |
| In the text | |
Current usage metrics show cumulative count of Article Views (full-text article views including HTML views, PDF and ePub downloads, according to the available data) and Abstracts Views on Vision4Press platform.
Data correspond to usage on the plateform after 2015. The current usage metrics is available 48-96 hours after online publication and is updated daily on week days.
Initial download of the metrics may take a while.