Fig. 1
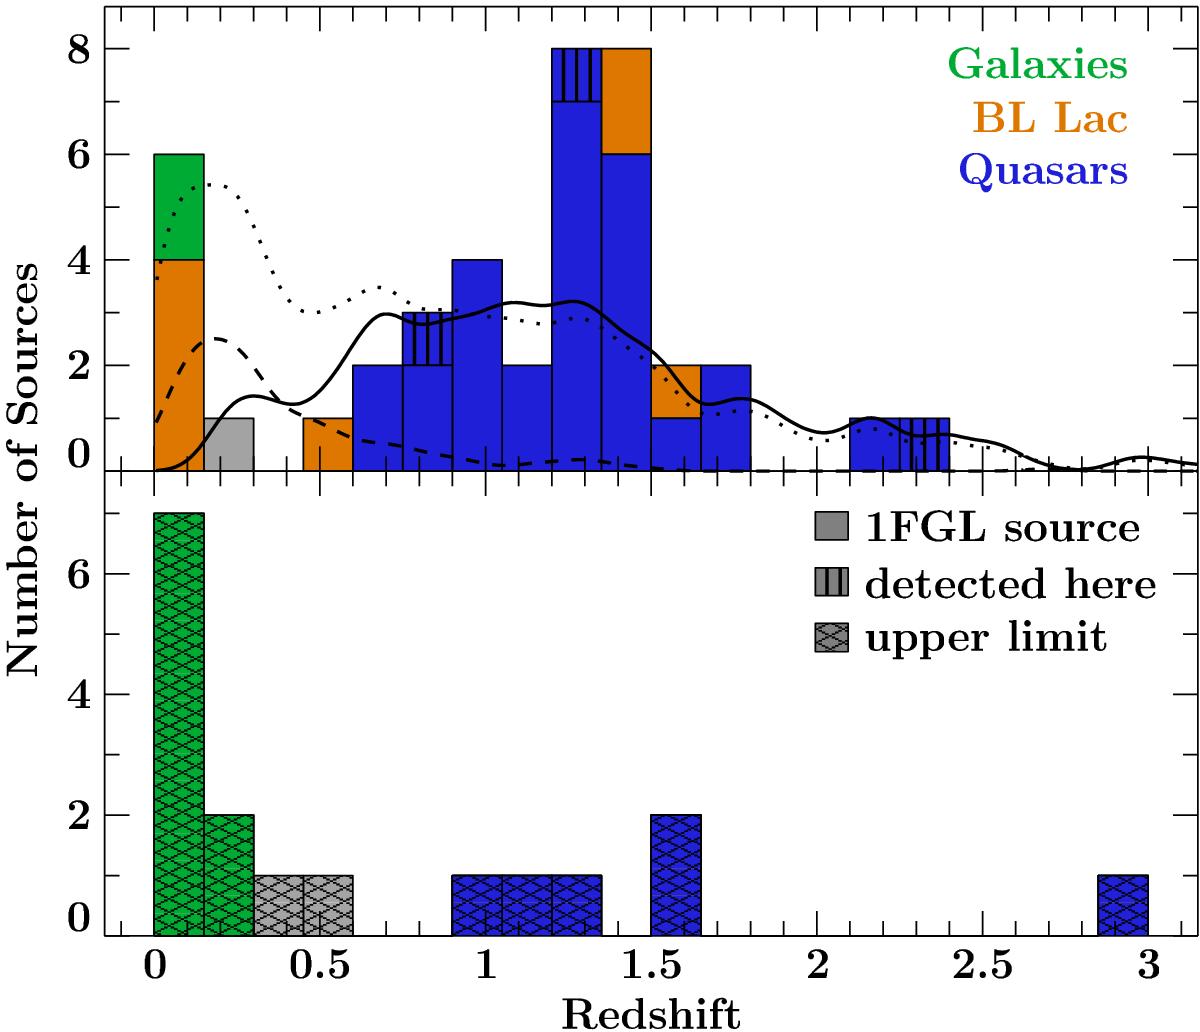
Redshift distribution of LAT detected (top panel) and nondetected sources (bottom panel). The lines in the top panel represent the redshift distributions of all Fermi/LAT-detected AGN (dotted line), of BL Lac objects (dashed line), and quasars (solid line) in the 2LAC, which are shown by a kernel density estimation (KDE) scaled to the corresponding numbers of TANAMI sources.
Current usage metrics show cumulative count of Article Views (full-text article views including HTML views, PDF and ePub downloads, according to the available data) and Abstracts Views on Vision4Press platform.
Data correspond to usage on the plateform after 2015. The current usage metrics is available 48-96 hours after online publication and is updated daily on week days.
Initial download of the metrics may take a while.