| Issue |
A&A
Volume 590, June 2016
|
|
|---|---|---|
| Article Number | C1 | |
| Number of page(s) | 2 | |
| Section | Interstellar and circumstellar matter | |
| DOI | https://doi.org/10.1051/0004-6361/201322725e | |
| Published online | 02 May 2016 | |
Resolving the chemical substructure of Orion-KL (Corrigendum)
1
Max-Planck-Institut für Astronomie, Königstuhl 17, 69117
Heidelberg,
Germany
e-mail: This email address is being protected from spambots. You need JavaScript enabled to view it.
2
Centro de Radioastronomia y Astrofisica, Universidad Nacional
Autonoma de Mexico, Morelia
Michoacan, Mexico
3
National Radio Astronomy Observatory, 1003 Lopezville Road, Socorro, NM
87801,
USA
Key words: stars: formation / ISM: abundances / stars: massive / ISM: lines and bands / ISM: molecules / errata, addenda
In Fig. 10 of Feng et al. (2015), the dashed lines are incorrectly printed as the solid lines. These dashed lines show the opacity-corrected estimates of the molecular column densities and abundances towards eight positions in Orion-KL. See the correct figure next page.
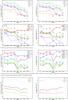 |
Fig. 10 Molecular column densities (panels in the left column) and abundances (panels in the right column) towards 8 positions in Orion-KL. The molecular abundances of each species with respect to H2 are converted from C18O, assuming a constant NC18O/NH2 ~ 1.79 × 10⁻⁷ ratio. Column densities and abundances with the uncertainties are measured as mentioned in Sect. 4.4 and Tables A.5−A.7. Coloured solid lines show the differentiation for each isotopologue calculated from optically thin assumption (arrows highlight the upper limits), while dashed lines show the differentiation calculated with optical depth correction from Eq. (10). For abundant molecules (e.g., HNCO, SO, SO2, CH3OH) which we have not measured their line optical depths, their densities could be underestimated by a factor of 7−10. |
© ESO, 2016
Current usage metrics show cumulative count of Article Views (full-text article views including HTML views, PDF and ePub downloads, according to the available data) and Abstracts Views on Vision4Press platform.
Data correspond to usage on the plateform after 2015. The current usage metrics is available 48-96 hours after online publication and is updated daily on week days.
Initial download of the metrics may take a while.