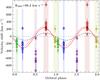
Fig. 9
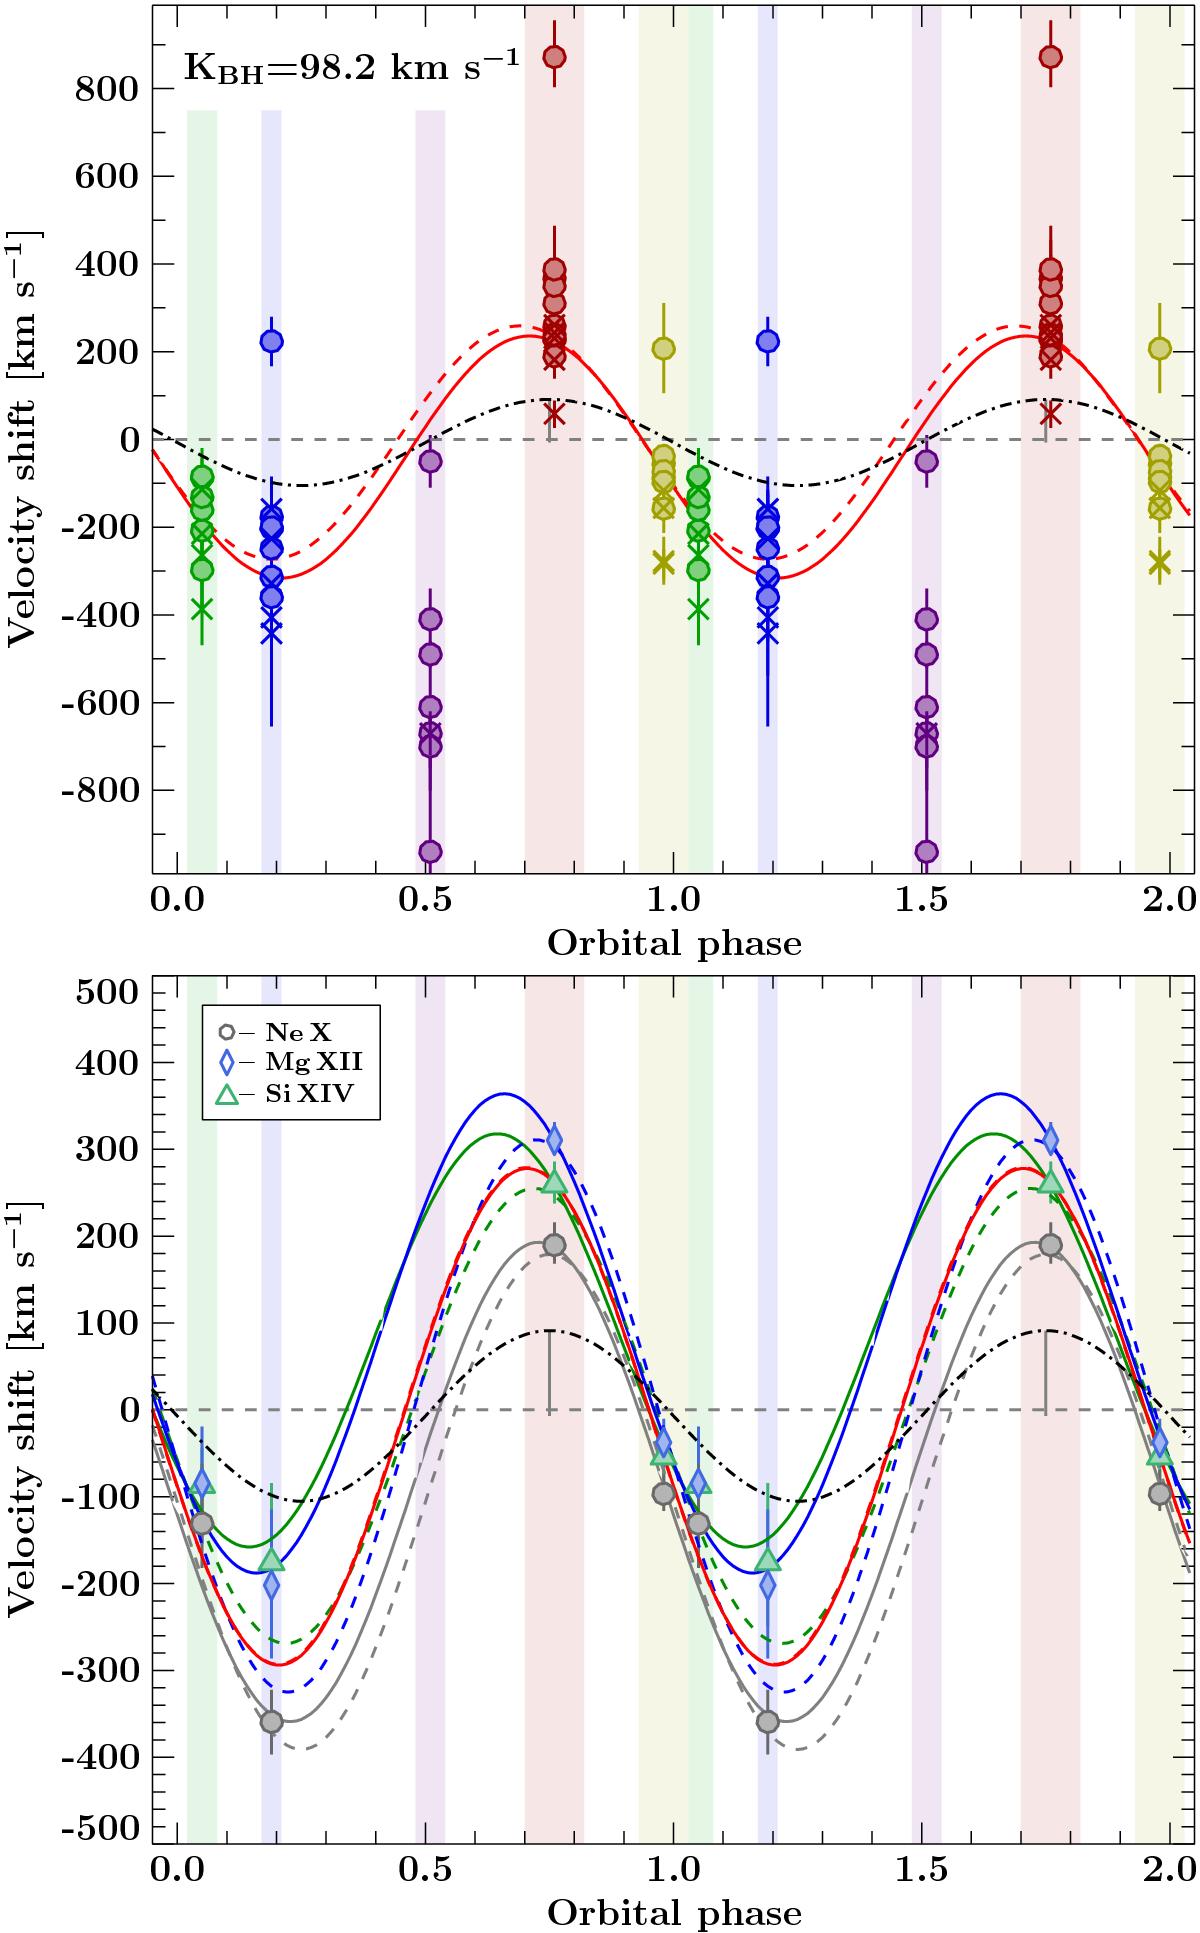
Top: velocity shifts of individual line series (circles: H-like and He-like ions, crosses: Fe line series) and the radial velocity of the black hole (dash-dotted line, semi-amplitude of ~98 km s-1). The red sine curve shows the best fit involving all series shown (KW ~ 276 km s-1, v0 ~ −40 km s-1, and Δφ ~ 0.46), while the dashed line shows the second best fit, where the offset was fixed to the systemic velocity of the black hole (Table 6). Bottom: velocity shifts for individual ions and the radial velocity of the black hole (dash-dotted line). The sine curves represent the best fits for each of the three given line series (Table 6). Dashed lines show fits with the offset fixed to the systemic velocity of the black hole. The red sine curve is the best fit involving all three line series (Table 6).
Current usage metrics show cumulative count of Article Views (full-text article views including HTML views, PDF and ePub downloads, according to the available data) and Abstracts Views on Vision4Press platform.
Data correspond to usage on the plateform after 2015. The current usage metrics is available 48-96 hours after online publication and is updated daily on week days.
Initial download of the metrics may take a while.