Fig. 8
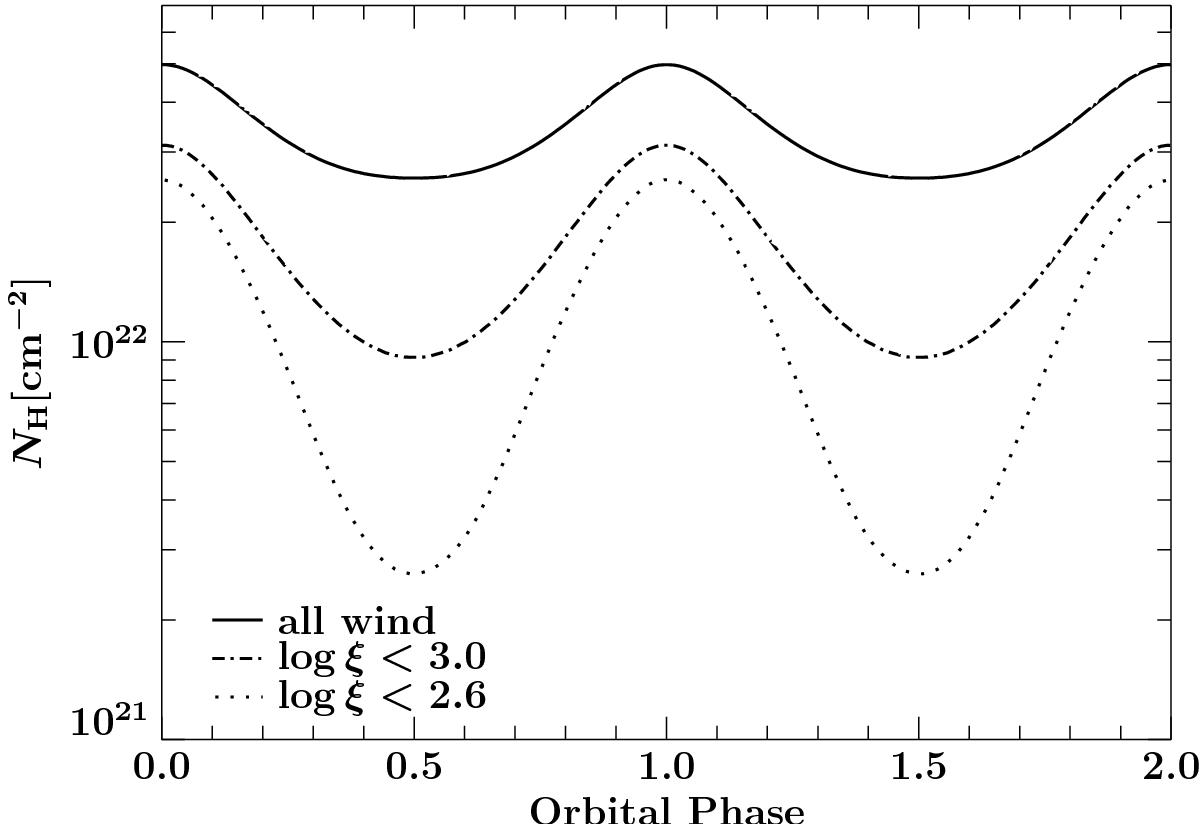
Phase variation of the column density according to the focused wind model of Gies & Bolton (1986). Shown is the column of the whole wind (solid line), and of those less ionized wind regions where the ionization parameter log ξ< 3.0 (dash dotted line) and log ξ< 2.6 (dotted line), respectively.
Current usage metrics show cumulative count of Article Views (full-text article views including HTML views, PDF and ePub downloads, according to the available data) and Abstracts Views on Vision4Press platform.
Data correspond to usage on the plateform after 2015. The current usage metrics is available 48-96 hours after online publication and is updated daily on week days.
Initial download of the metrics may take a while.