Fig. 5
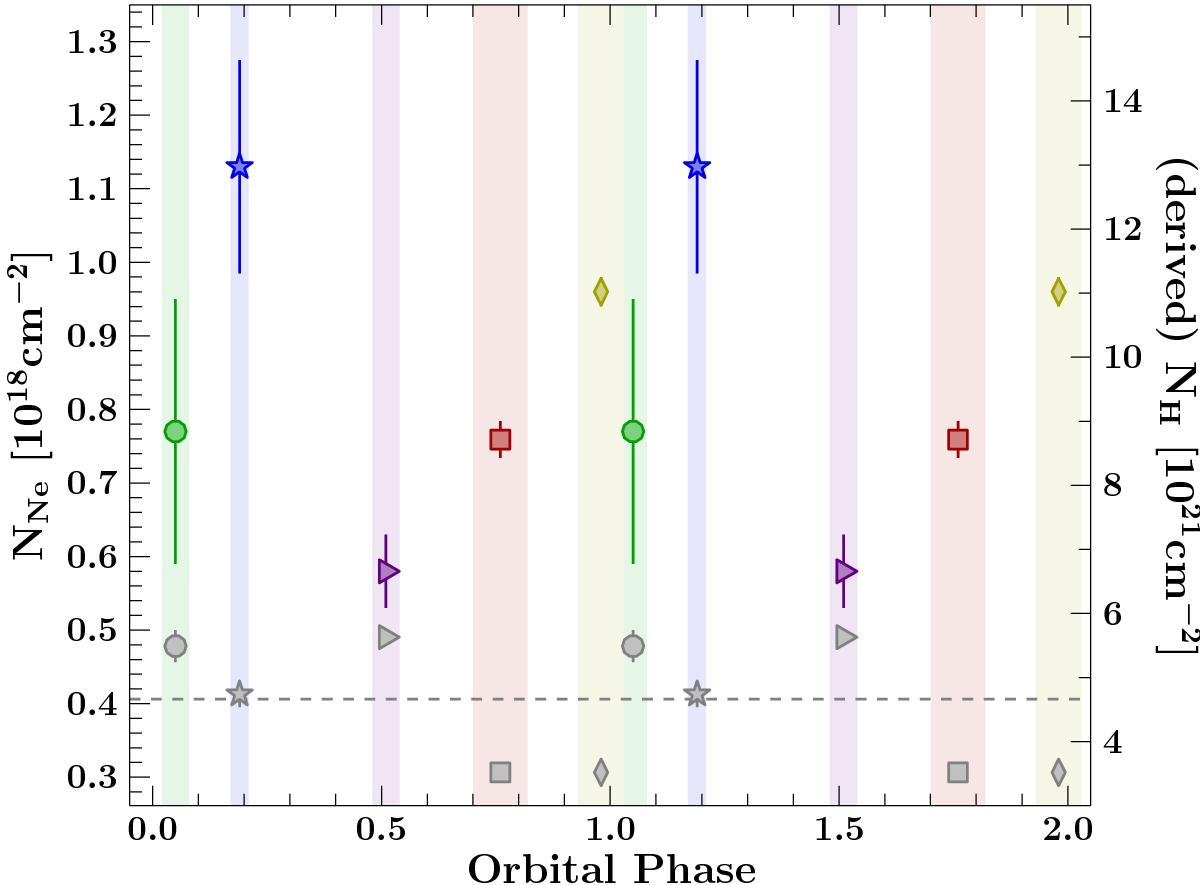
Orbital phase variation of fitted columns, repeated twice for clarity. Gray data points show the equivalent hydrogen column density, NH, from continuum fitting the Chandra spectra (right hand y-axis). As discussed in the text, the data points are heavily influenced by systematics (the error bars shown are statistical only). The colored data points show the variation of the Ne neutral column from Ne-edge fitting (left y-axis) and corresponding NH (right y-axis) derived assuming a Ne:H abundance of 1:11481 as per Wilms et al. (2000). The phases of individual Chandra observations are denoted with colored regions. The dashed lines represent the total equivalent column density of the interstellar medium and of Ne (Xiang et al. 2011).
Current usage metrics show cumulative count of Article Views (full-text article views including HTML views, PDF and ePub downloads, according to the available data) and Abstracts Views on Vision4Press platform.
Data correspond to usage on the plateform after 2015. The current usage metrics is available 48-96 hours after online publication and is updated daily on week days.
Initial download of the metrics may take a while.