Fig. 2
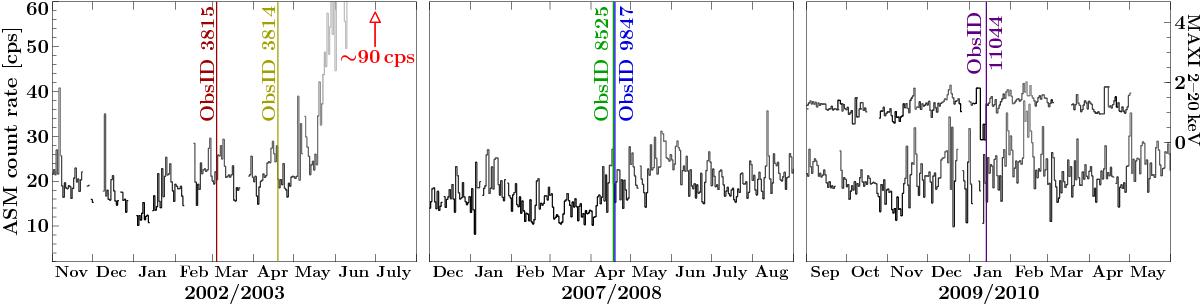
1.5–12 keV RXTE-All-Sky Monitor count rate of Cyg X-1 with one day binning in the intervals of nine months during 2003, 2008, and 2010 centered at the times of Chandra observations: ObsIDs 3815 and 3814 (left), 8525 and 9847 (middle), and 11044 (right), indicated by vertical lines. The right panel also shows the MAXI light curve.
Current usage metrics show cumulative count of Article Views (full-text article views including HTML views, PDF and ePub downloads, according to the available data) and Abstracts Views on Vision4Press platform.
Data correspond to usage on the plateform after 2015. The current usage metrics is available 48-96 hours after online publication and is updated daily on week days.
Initial download of the metrics may take a while.