Fig. C.1
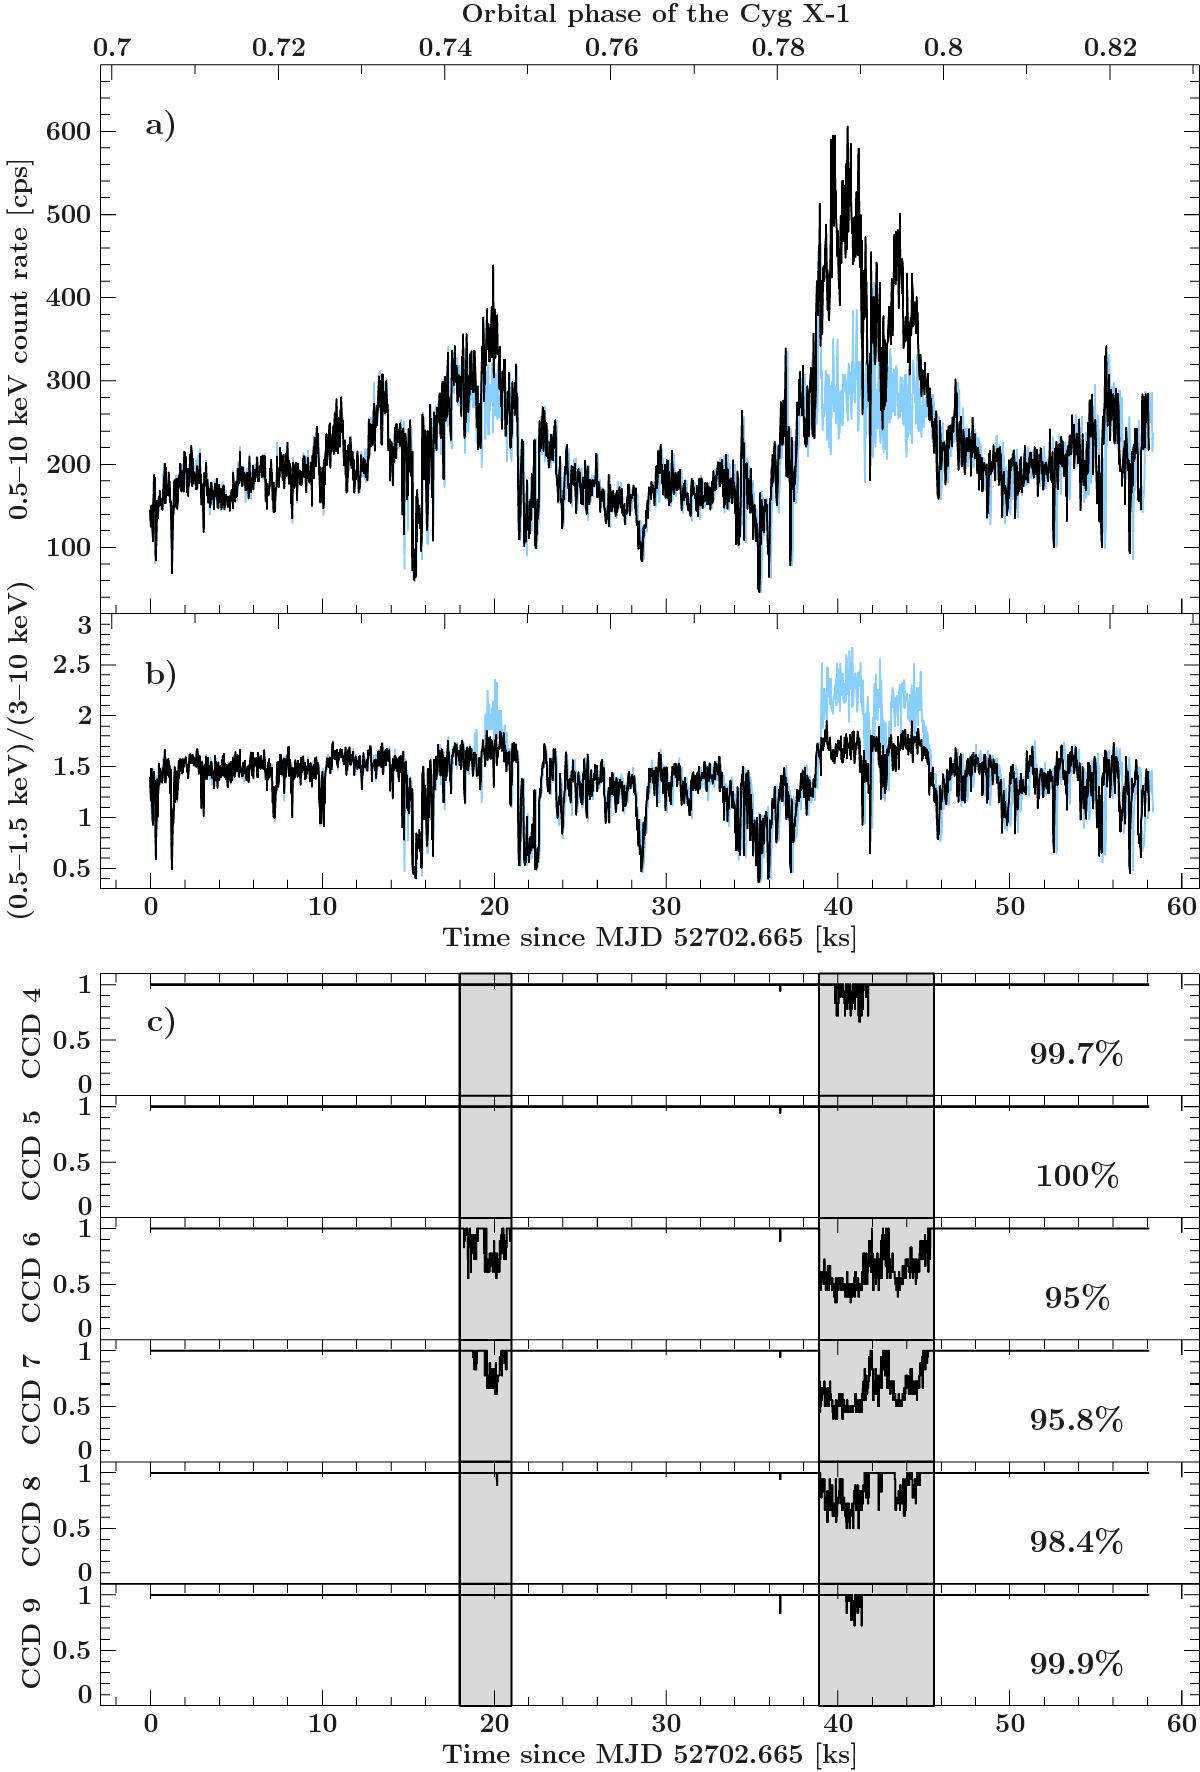
a) 0.5–10 keV Chandra light curve of Cyg X-1 (time resolution of 25.5 s), obtained in 2003 March (ObsID 3815). Light blue: light curve without taking telemetry drop-outs into account. Black: light curve after correcting for telemetry drop-outs. b) Ratio between the 0.5–1.5 keV and 3–10 keV energy bands, again with and without correction for the telemetry saturation. c) Fractional exposure during the observation for each CCD. Telemetry drop-outs appeared at ~20 ks and after ~40 ks (gray regions). In the latter case, 5 of 6 CCDs were affected. Since whole data frames were discarded, lower count rates were observed in the light curve in the affected time intervals before the correction was applied (panel a)). The spectrum extracted for those GTIs might be influenced as well, especially in the wavelength range of affected CCDs. These GTIs were not used in the analysis, even after correction of the count rates.
Current usage metrics show cumulative count of Article Views (full-text article views including HTML views, PDF and ePub downloads, according to the available data) and Abstracts Views on Vision4Press platform.
Data correspond to usage on the plateform after 2015. The current usage metrics is available 48-96 hours after online publication and is updated daily on week days.
Initial download of the metrics may take a while.