Fig. B.1
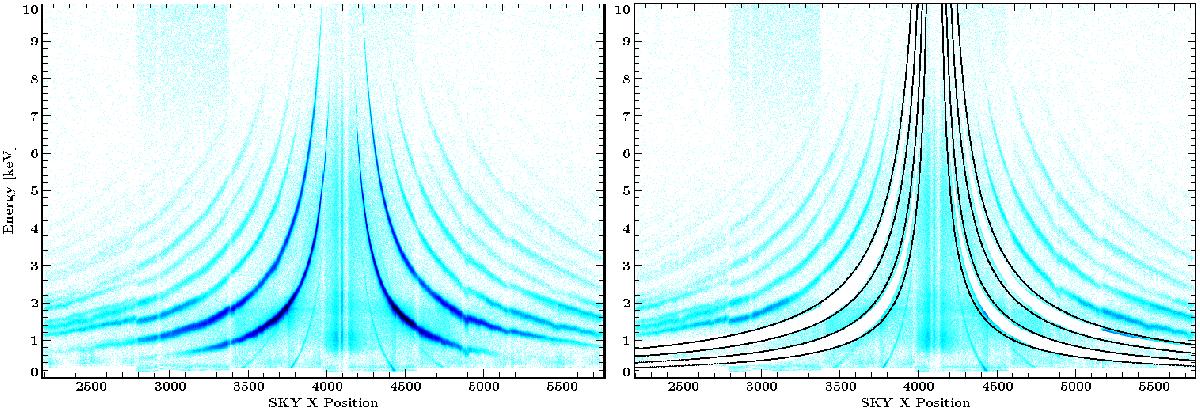
Banana plot – order-sorting of incoming events. Left: diffraction orders for the HEG and MEG instruments. The source itself is located at sky x-position x = 4100. The higher density of events around this region is most likely associated with a scattering halo. The different orders correspond to hyperbolas, shaped by a higher density of events. The hyperbolas with the highest event density, close to the source, represent the ± 1st order of HEG and MEG. Right: same as left figure, but showing the events assigned to the HEG and MEG in standard processing (white regions). Not all of the events are included. Changing the OSIP parameters, as described in the text, enables us to include all events belonging to each order in the analysis (black lines).
Current usage metrics show cumulative count of Article Views (full-text article views including HTML views, PDF and ePub downloads, according to the available data) and Abstracts Views on Vision4Press platform.
Data correspond to usage on the plateform after 2015. The current usage metrics is available 48-96 hours after online publication and is updated daily on week days.
Initial download of the metrics may take a while.